There is a growing number of great database performance monitoring systems out there. Recently, the more traditional on-premises solutions have been joined by software as a service (SaaS) solutions.
This blog contrasts the typical architecture of an on-premises solution with that of a SaaS solution. Of course, components will vary in name and structure from one vendor to another, but the key concepts discussed here will be represented on one form or another.
Differences Between On-Premises and SaaS Solutions
Overall, here are some of the key components of each solution:
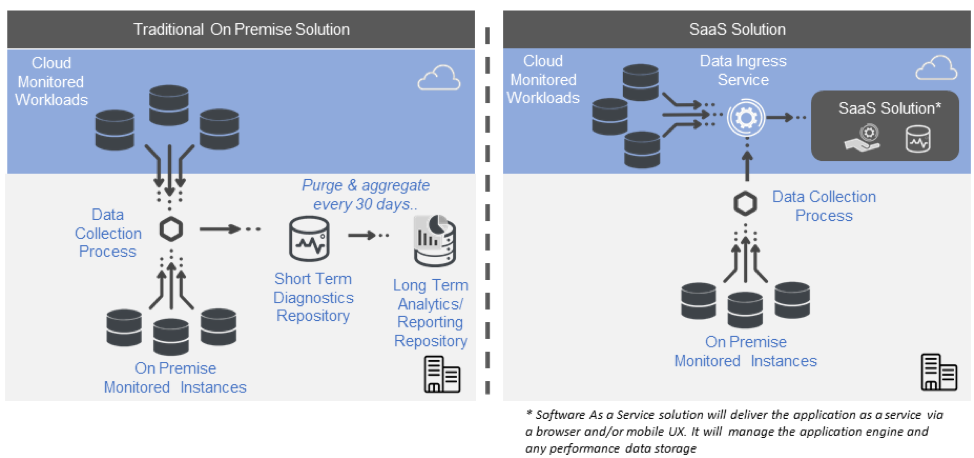
Traditional On-Premises Solution
- Data collection process.
- Short-term performance [diagnostics] repository.
- Long-term analytic/reporting repository.
- Windows or browser client.
- Any failover infrastructure required for the monitoring infrastructure.
SaaS Solution
- Data collection process (for on-premises targets).
- Browser client.
- Mobile app.
- The SaaS vendor manages the application and back-end data storage.
Note that the names of the various components will vary from one solution to another. In some cases, functionality may be split across multiple services or data sources.
On-Premises Solutions
Data Collection Process
The data collector is typically an on-premises, agentless service that collects data from any on-premises monitored endpoint. This process orchestrates how and when data is collected. It should be capable of collecting data at different frequencies to balance the need for more detail with impact on the monitored workload. Collection frequencies and alert thresholds should come preconfigured across each metric.
Everyone will have a “noisy” instance that does not conform to standard thresholds. This can result in a lot of false positives. To deal with this, the system should have the capability to create instance-level rules to deal with exceptional circumstances. This avoids “alarm fatigue” from false positives.
In some cases, this service also orchestrates alerts and notifications. In large organizations with hundreds of monitored instances, it may be necessary to balance the load by “federating” across a number of data collectors. Federation synchronizes collections and configuration across a dispersed system.
Short-Term Diagnostics Repository
This is where detailed data is stored. This would include data from DMVs, log files, XEvents, and other SQL Server data sources. Sources that could exert pressure on the monitored instances should be avoided, e.g., most traces are unsuitable for real-time monitoring.
Because collection frequencies can be as often as every second and larger data chunks such as TSQL and plans are collected, this repository can get big fast. As a result, most systems will typically limit the history to between a week and a month (these limitations do not apply to a SaaS solution). This repository is highly transactional in nature.
Long-Term Reporting/Analytics Repository
At the end of a predefined time, this detailed data is aggregated and stored in a reporting repository for high-level analytics and trending. The amount of detail retained will have a significant impact on the eventual size of this repository and the compute capacity that one can reasonably expect a user to make available to analyze it. This tends to vary considerably from one solution to the next. Solutions that support deeper analytics will have supporting architectures and may use OLAP architectures to facilitate multidimensional analysis.
Scaling an On-Premises Monitoring Solution
More sophisticated solutions will be designed to facilitate a distributed architecture of the key components to support scale. The data collection service will have an upper number of monitored connections it can support. Once this limit is reached, an additional data collector should be “federated” to coordinate data collection and orchestrate the storage of the data.
The performance data repositories themselves can share one instance or may be spread across several instances to support scale. The storage they require will be directly proportional to the number of monitored connections and the volume of data retained. The structure and architecture of the analytics repository will also affect the total capacity.
User Experience
Most on-premises tools will have a Windows front end. Some have browser front ends based on a locally hosted deployment. Remote access to these can be convoluted and typically require VPN. They rarely support mobile apps.
High Availability
Monitoring software that monitors mission-critical workloads needs to be resilient in its own right. Provision should be made to handle disaster situations that may put the monitoring structure offline. This should also be considered from an architecture and cost perspective.
SaaS Solutions
Data Collection Process
Though a SaaS offering is primarily hosted, it will often maintain an on-premises data collector for on-premises workloads. This helps address performance and security constraints. In this manner, any instance-level connections are made via the on-premises collector, which then relays the monitored database performance data to the cloud ingress service. All data should be encrypted in transit.
Diagnostics and Reporting/Analytics Repositories
The good news here is that the SaaS vendor handles all of your data storage. You don’t need to worry about standing up instances for the diagnostics repositories, reporting repositories, flushing the diagnostics repository, or many of the other headaches associated with an on-premises deployment.
Hosted solutions will draw on different storage strategies in the back end to facilitate a mix of transactional and analytic activity as appropriate. They can draw on cloud resources to handle higher data volumes and the requisite processing required for analytics; e.g., Spotlight Cloud keeps one year of detailed data. So not only can you report a year back in time, but you can also play back your workload up to a year in the past. This is a really powerful capability.
A SaaS solution for database performance monitoring can use a variety of back-end storage strategies not only to suit the more transactional nature of diagnostics and monitoring but also to facilitate the high-intensity number crunching associated with long-term analytics. The SaaS vendor can draw on considerable economies of scale to use far more powerful infrastructure that would be at the disposal of individual organizations.
How to Scale a SaaS solution
Scaling a SaaS solution is the responsibility of the vendor and not the user. Any SaaS solution for database performance monitoring has to be built to scale from day one and, as a result, it tends to handle scale in its stride.
User Experience
SaaS applications will default to a browser Ux and many will have comprehensive mobile apps also. This facilitates dispersed and remote teams.
Security and Compliance
Most SaaS solutions will be built on one of the leading cloud infrastructures, such as Azure or Amazon. Many of the leading vendors have sophisticated security infrastructures in place. They are heavily invested in supporting the compliance needs of their clients.
High Availability
The good news here again is that this is the responsibility of the vendor. It is worth checking with your vendor to find out what provision they have made in terms of failover and high availability. SaaS applications should be architected to be very resilient. The various services that make up a SaaS application are typically designed to be individually resilient. Provision can also be made for data center outages where the application would fail over from one data center to another in the event of a data center outage.