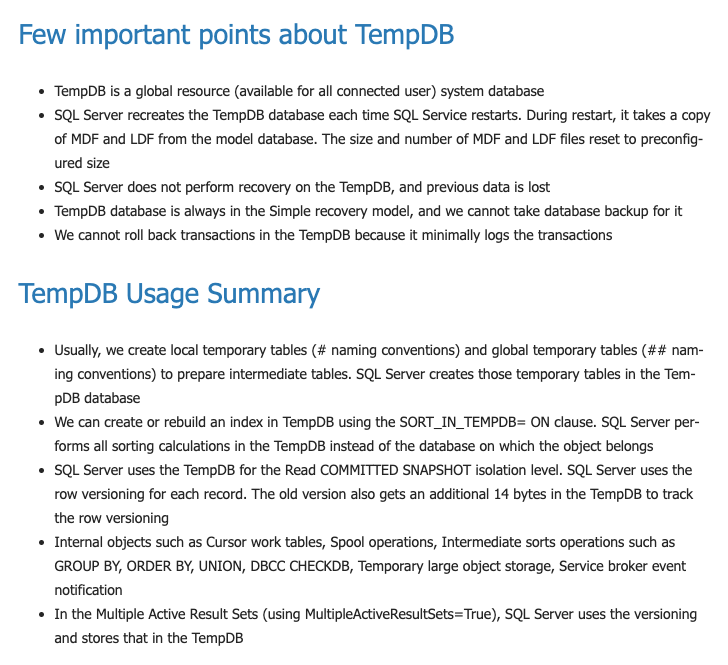
Each SQL Server instance contains the system SQL Server database called TempDB. It is typical for all database connections, and almost every query makes usage of the TempDB database. It is like a heart for the SQL Server instance. Practically, we cannot work without the TempDB database.
Let us have a quick summary of operations in which SQL Server uses TempDB.
- Order by and Group by clause
- Index creation and online index rebuild
- Temp tables and table variables storage is in the TempDB database.
- Snapshot isolation and read committed snapshot isolation
- DBCC commands
- Hash joins static cursors, long-running transactions.
- XML queries
- Internal objects created by the SQL Server database engine.
- Version stores
- Multiple active record sets (MARS)
You can read more about TempDB in this article.
SQL Server recreates this TempDB database on database engine Service restart. This restart can be due to the automatic or manual restart of SQL Service. We can query sys.databases for viewing the TempDB creation date that is also a start-up time of database service:
SELECT create_date AS 'SQL Service Startup Time'
FROM sys.databases
WHERE name = 'tempdb';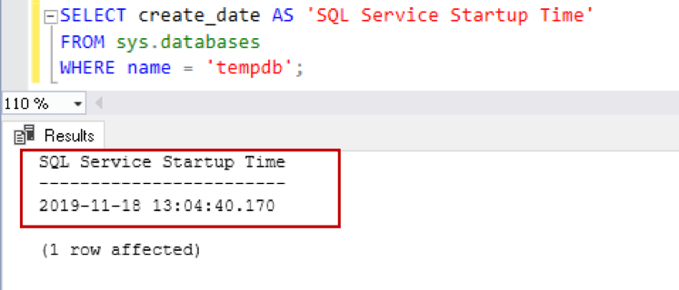
TempDB SQL Server database configurations and best practices
Sometimes, we notice unexpected growth of the TempDB database. The first step of avoiding this is to configure it as per the best practices. In this section, let's view the TempDB configuration is different versions of SQL Server.
Configure TempDB for multiple DATA Files with even growth
As per best practice, we should have multiple data files with even growth of all files. The number of files depends upon the logical processors.
| Processors |
Number of TempDB data files |
|
Logical processors less than or equals to eight |
Eight |
|
Logical processors greater than eight |
Start with eight data files. Increase the data files in multiple of four and monitor the performance counters for TempDB contention. |
For SQL Server versions before 2016, we do not have configuration available during the installation process.
By default, it creates only one data and log file with the following configurations:
|
TempDB Primary file |
Auto grow data file by ten percent (until the disk is full) |
|
TempDB log file |
Auto grow data file by ten percent (until the disk is full or maximum log file size reaches to 2 TB) |
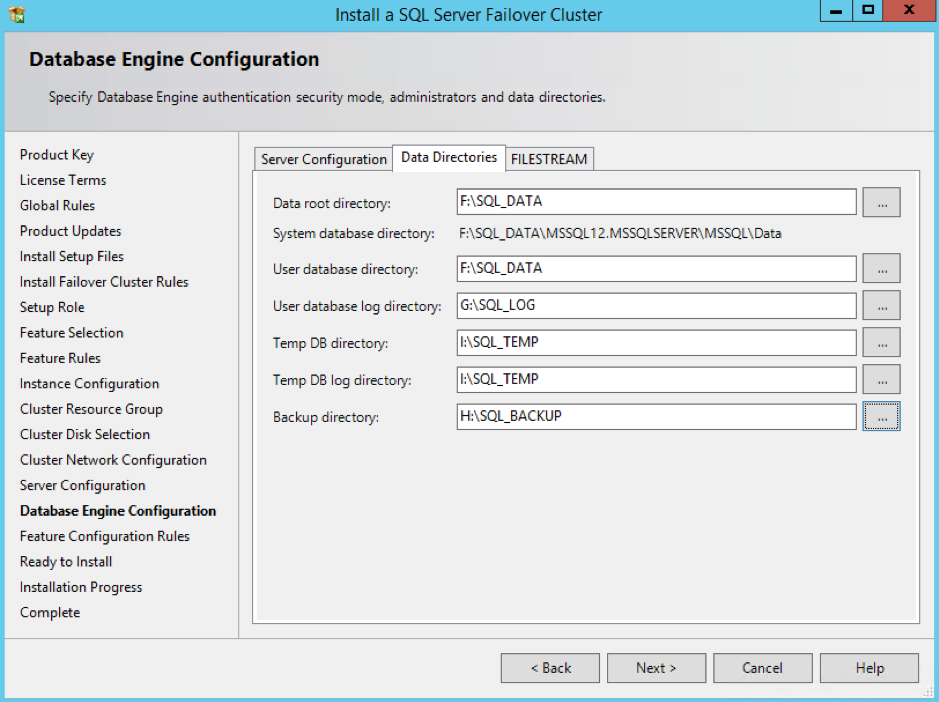
SQL Server 2014 TempDB SQL Server database configuration
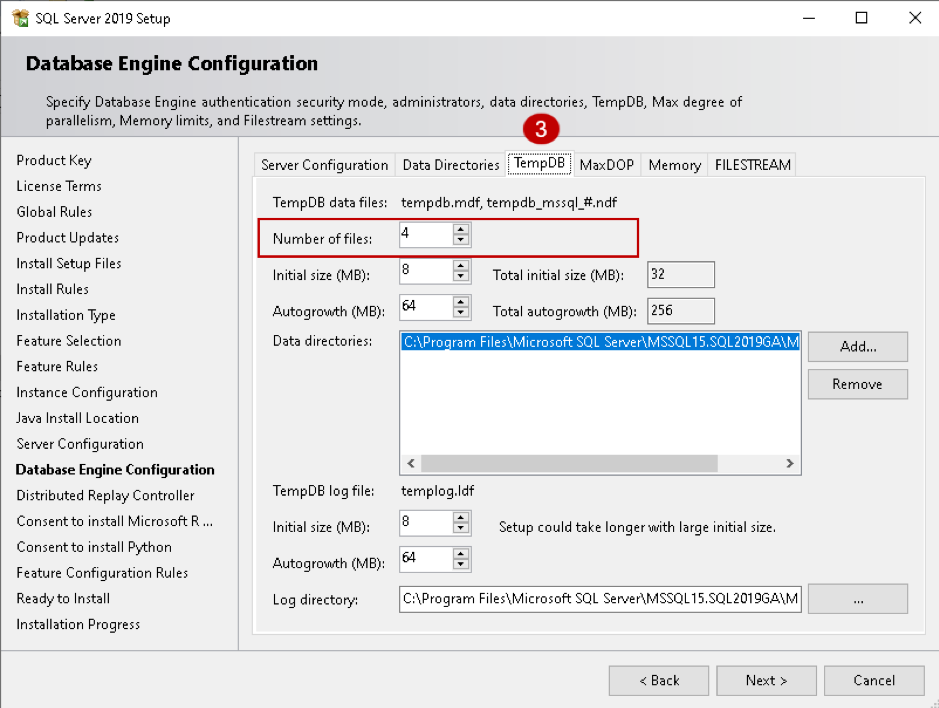
SQL Server 2016 provides enhancements for TempDB configuration during the installation process as per the best practice:
|
TempDB Primary and secondary files |
Auto grow by 64 MB (until the disk is full) |
|
TempDB log file |
Auto grow by 64 MB (until the disk is full or maximum log file size reaches to 2 TB) |
SQL Server 2016 onwards TempDB configuration
Uneven auto-growth SQL Server database TempDB
SQL Server uses a round-robin method to fill multiple data files if they do not have the same size. Sometimes, we see that one file grows huge, but other files remain minimum growth. In case of uneven files, SQL Server uses the larger file for most of the queries, and it would continue growing:
- Use the same auto-growth of TempDB files (as discussed in the previous point).
- Enable trace flag 1117 for growing all data files together in a database.
The second point is fixed automatically in SQL Server 2016 onwards however you should enable it in earlier versions. We do not require this trace flag in SQL Server 2016 and higher.
TempDB growth scenarios
In this section, we will see a few scenarios for SQL Server database TempDB growth. In my SQL instance, I have eight data files with the following configuration:
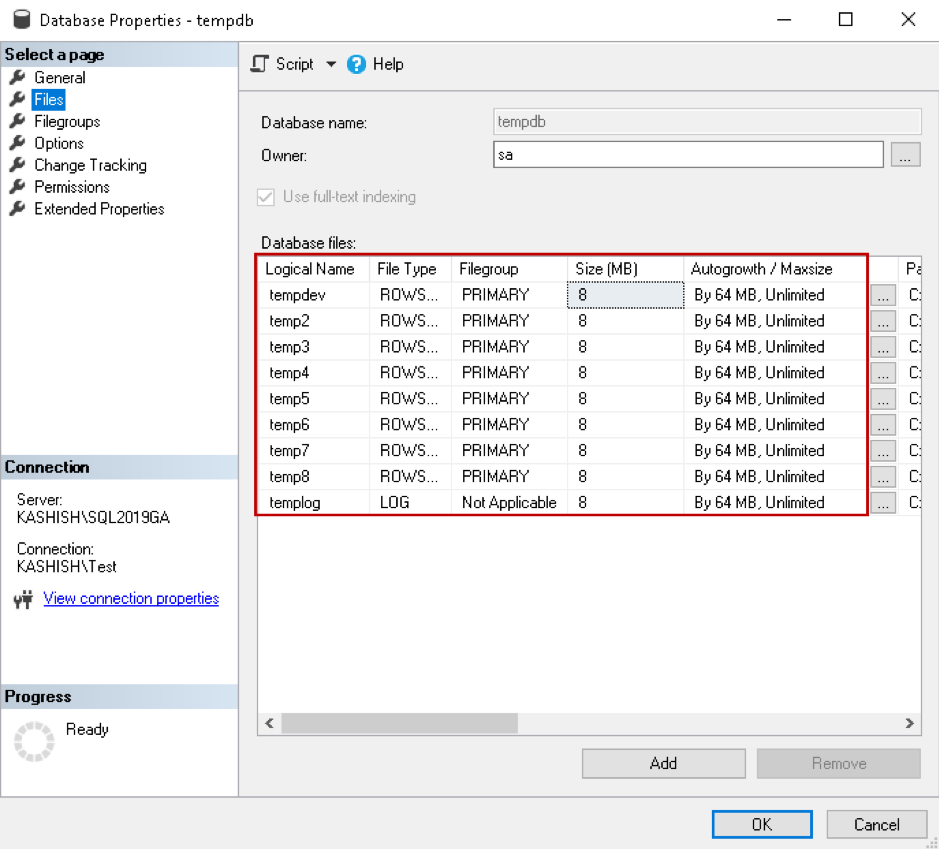
Now, execute the following query to create a temporary table and perform data insertion. The temporary table storage location is the TempDB database. This query uses a CROSS JOIN operator with multiple columns and further sorts the results using the ORDER BY clause.
Note: Do not run this query in the production system; I am using it for demo purpose only.
 SELECT *

FROM sys.configurations

     CROSS JOIN sys.configurations SCA

     CROSS JOIN sys.configurations SCB

     CROSS JOIN sys.configurations SCC

     CROSS JOIN sys.configurations SCD

     CROSS JOIN sys.configurations SCE

     CROSS JOIN sys.configurations SCF

     CROSS JOIN sys.configurations SCG

     CROSS JOIN sys.configurations SCH

ORDER BY SCA.name,

         SCA.value,

         SCC.value_in_use DESC;
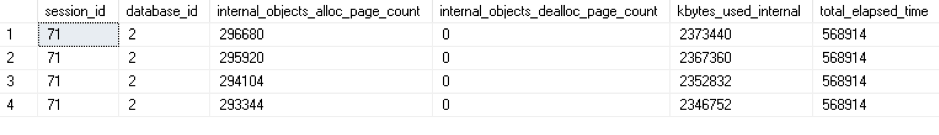
This query will take a long time and might result in high CPU usage as well in your system. While the query is running, open another query window and use the DMV sys.dm_db_task_space_usage to get information of page allocation and deallocation activity by the task. We join this DMV with other DMV's to get the required information for the SQL Server database TempDB:
SELECT s.session_id, dbu.database_idIn the output, we see internal object page counts and their sizes (kbytes_used_internal) for the session ID 55. SQL Server query optimizer executing this query in a parallel model; therefore, we can see multiple session ID 71 in the output:
, dbu.internal_objects_alloc_page_count, dbu.internal_objects_dealloc_page_count
, (dbu.internal_objects_alloc_page_count - dbu.internal_objects_dealloc_page_count) * 8192 / 1024 kbytes_used_internal
, r.total_elapsed_time
FROM sys.dm_Exec_requests r
INNER JOIN sys.dm_exec_sessions s ON r.session_id = s.session_id
LEFT JOIN sys.dm_db_task_space_usage dbu ON dbu.session_id = r.session_id
AND dbu.request_id = r.request_id
WHERE internal_objects_alloc_page_count > 0
ORDER BY kbytes_used_internal DESC;
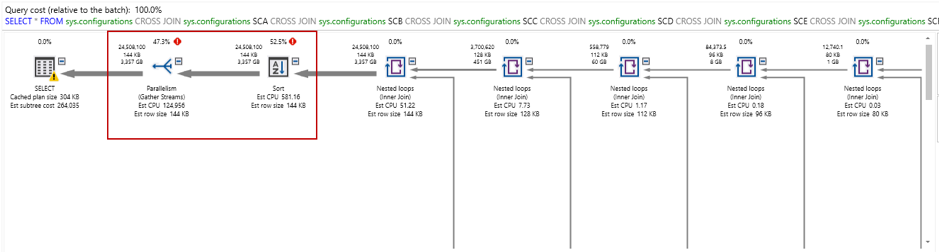
You can also view the estimated execution plan, and as shown below, we get two costly operators:
- Parallelism: 47.3%
- Sort: 52.3%
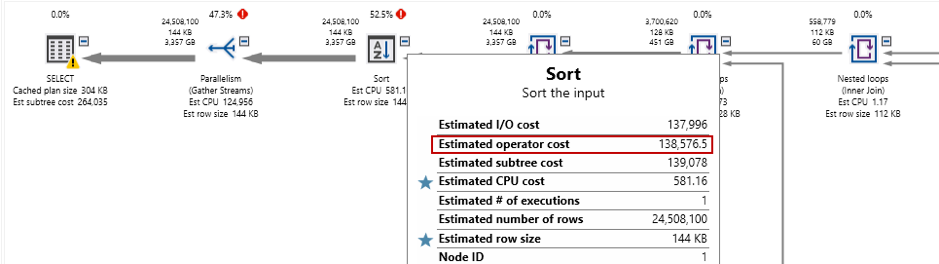
In the sort operator, we can see high estimated operator cost 138,576.5:
The following query uses DMV sys.dm_db_file_space_usage and joins it with sys.master_files to check the allocated and unallocated extent page counts in the SQL Server database TempDB while the query is executing:
select mf.physical_name, mf.size as entire_file_page_count,

          dfsu.unallocated_extent_page_count,

          dfsu.user_object_reserved_page_count,

          dfsu.internal_object_reserved_page_count,

          dfsu.mixed_extent_page_count

from sys.dm_db_file_space_usage dfsu

          join sys.master_files as mf

                   on mf.database_id = dfsu.database_id

                         and mf.file_id = dfsu.file_id
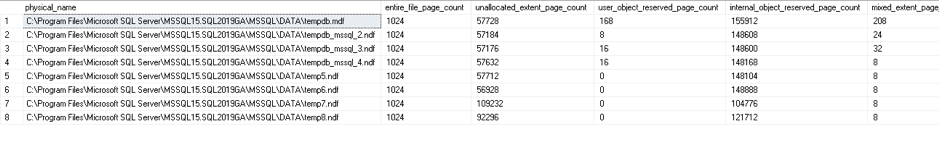
We can monitor the query execution, its usage in the TempDB database and if required, kill the process to release the space immediately. We should also optimize the query causing massive TempDB growth.
Monitor SQL Server database TempDB usage using extended events
Extended events are useful for TempDB database monitoring. We can add the following extended events using the query:
- database_file_size_change
- databases_log_file_used_size_changed
Create extended event
CREATE EVENT SESSION [TempDB Usage] ON SERVER

ADD EVENT sqlserver.database_file_size_change(


ACTION(sqlserver.client_hostname,sqlserver.database_id,sqlserver.session_id,sqlserver.sql_text)),

ADD EVENT sqlserver.databases_log_file_used_size_changed(


ACTION(sqlserver.client_hostname,sqlserver.database_id,sqlserver.session_id,sqlserver.sql_text))

ADD TARGET package0.event_file(SET filename=N'TempDBUsage',max_rollover_files=(0))

WITH (STARTUP_STATE=OFF)

GO
Start extended event session
ALTER EVENT SESSION [TempDBTest] ON SERVER STATE = START;
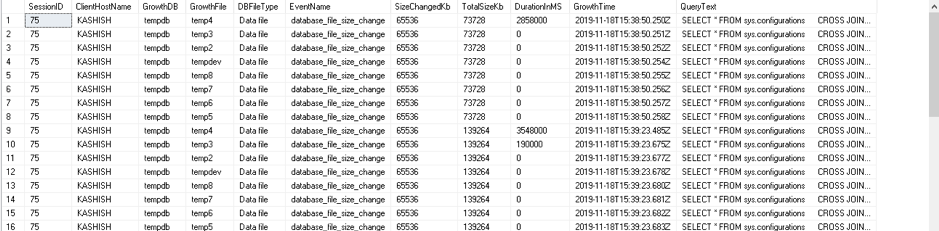
Now, execute your workload to use the TempDB database and grow the data files. The extended events capture data file growth and query that caused this growth.
You can either view the extended event session file in SSMS GUI mode or use the following query to monitor TempDB growth.
Monitor TempDB Growth
SELECT [eventdata].[event_data].[value]('(event/action[@name="session_id"]/value)[1]', 'INT') AS [SessionID],

[eventdata].[event_data].[value]('(event/action[@name="client_hostname"]/value)[1]', 'VARCHAR(100)') AS [ClientHostName],

DB_NAME([eventdata].[event_data].[value]('(event/action[@name="database_id"]/value)[1]', 'BIGINT')) AS [GrowthDB],

[eventdata].[event_data].[value]('(event/data[@name="file_name"]/value)[1]', 'VARCHAR(200)') AS [GrowthFile],

[eventdata].[event_data].[value]('(event/data[@name="file_type"]/text)[1]', 'VARCHAR(200)') AS [DBFileType],

[eventdata].[event_data].[value]('(event/@name)[1]', 'VARCHAR(MAX)') AS [EventName],

[eventdata].[event_data].[value]('(event/data[@name="size_change_kb"]/value)[1]', 'BIGINT') AS [SizeChangedKb],

[eventdata].[event_data].[value]('(event/data[@name="total_size_kb"]/value)[1]', 'BIGINT') AS [TotalSizeKb],

[eventdata].[event_data].[value]('(event/data[@name="duration"]/value)[1]', 'BIGINT') AS [DurationInMS],

[eventdata].[event_data].[value]('(event/@timestamp)[1]', 'VARCHAR(MAX)') AS [GrowthTime],

[eventdata].[event_data].[value]('(event/action[@name="sql_text"]/value)[1]', 'VARCHAR(MAX)') AS [QueryText]

FROM

(

SELECT CAST([event_data] AS XML) AS [TargetData]

FROM [sys].[fn_xe_file_target_read_file]('C:\TEMP\TempDBusage*.xel', NULL, NULL, NULL)

) AS [eventdata]([event_data])

WHERE [eventdata].[event_data].[value]('(event/@name)[1]', 'VARCHAR(100)') = 'database_file_size_change'

OR [eventdata].[event_data].[value]('(event/@name)[1]', 'VARCHAR(100)') = 'databases_log_file_used_size_changed'

AND [eventdata].[event_data].[value]('(event/@name)[1]', 'VARCHAR(MAX)') <> 'databases_log_file_used_size_changed'

ORDER BY [GrowthTime] ASC;
Snapshot Isolation
You might use snapshot isolation for your queries. In this isolation model, SQL Server stores the updated row versions of each transaction in the TempDB. In case of a large or long-running transaction, you can see a huge TempDB database.
You can execute the transaction with the SET command and specify Snapshot isolation:
SET TRANSACTION ISOLATION LEVEL SNAPSHOT;

BEGIN TRAN;

UPDATE [AdventureWorks].[Person].[Person]

SET

[Title] = 'Mr.';

COMMIT TRAN;
You can also query sys.databases system view to check if any user database has snapshot isolation.
Query to enable snapshot isolation on AdventureWorks database
ALTER DATABASE AdventureWorks

SET ALLOW_SNAPSHOT_ISOLATION ON

GO
Query to check user database with snapshot isolation
SELECT *

FROM sys.databases

WHERE(snapshot_isolation_state = 1

OR is_read_committed_snapshot_on = 1)

AND database_id > 4;
In the following screenshot, you can see that the AdventureWorks database has snapshot isolation. TempDB database also has snapshot isolation, but in the query, we have skipped database_id less than 4:

We can use DMV sys.dm_db_file_space_usage to monitor version store in the TempDB:
SELECT GETDATE() AS runtime,

SUM(user_object_reserved_page_count) * 8 AS usr_obj_kb,

SUM(internal_object_reserved_page_count) * 8 AS internal_obj_kb,

SUM(version_store_reserved_page_count) * 8 AS version_store_kb,

SUM(unallocated_extent_page_count) * 8 AS freespace_kb,

SUM(mixed_extent_page_count) * 8 AS mixedextent_kb

FROM sys.dm_db_file_space_usage;
Here, we can see Version store size is 67968 KB. For a large or long-running transaction, you can see a huge SQL Server database TempDB size due to this version store:

Another case that might cause a huge size of the version store is Always on read-only Secondary replica. If you execute any query on the secondary database, it automatically uses the snapshot isolation level. As you know, snapshot isolation level copies row version in the TempDB.
You should monitor the following perfmon counters:
- SQLServer:Transactions\Longest Transaction Running Time – It captures the most extended active transaction.
- SQLServer:Transactions\Version Store Size (KB) – It captures the current size of all the version stores in TempDB.
- SQLServer:Transactions\Version Cleanup rate (KB/s) – You can use this counter to show the rate of version cleanup in TempDB
- SQLServer:Transactions\Version Generation rate (KB/s) – You can capture version store capture rate using this counter.
You should monitor TempDB growth for the versioning in Always on the secondary database as well. Kill the long-running sessions so that it can clear the versioning and reclaim space in the TempDB database.
Conclusion
In this article, we learned about the SQL Server database TempDB database best practice and different methods to detect, prevent unexpected growth. You should monitor TempDB regularly and configure different alerts to be proactive.
- TempDB size monitoring
- Drive space monitoring
- Long-running transactions