Today, I'm going to walk through an exciting new feature called "Playback" that we've added to Spotlight Cloud.
Playback enables you to diagnose problems that occurred in the past with SQL Server. Using Spotlight Cloud's web interface, you can choose a time in the past when your SQL Server experienced performance issues and "play back" what happened at that particular time to help you identify the cause.
Benefits of Historical Data in Database Performance Monitoring
We're all familiar with the frustration of having a user report a problem they experienced the day before, only to find when investigating the problem that everything is working just fine.
Why did this problem occur? If only they'd told me at the time it happened, I could've done something about it. If only I could go back and see what was happening at that exact time.
Well, now you can.
With Playback, you can rewind back up to a year and go to the point in time an issue occurred and view what was happening on the server.
For example, users reported slow performance when creating reports on the sixth of March. Looking at the current data, I can't get a good grasp of what the problem is. I need to rewind back and see how the server was performing on that day.
Time Period Selection to Zero in on Database Issues
Using the time period selector at the top right of the screen (shown below), I select the date and time the issue occurred and press apply.

The Overview screen reloads, showing the state of the SQL Server on March 6.
I can view the top five alarms occurring at that time and see that Session 76 was blocked for 112 seconds at 1:32 p.m.
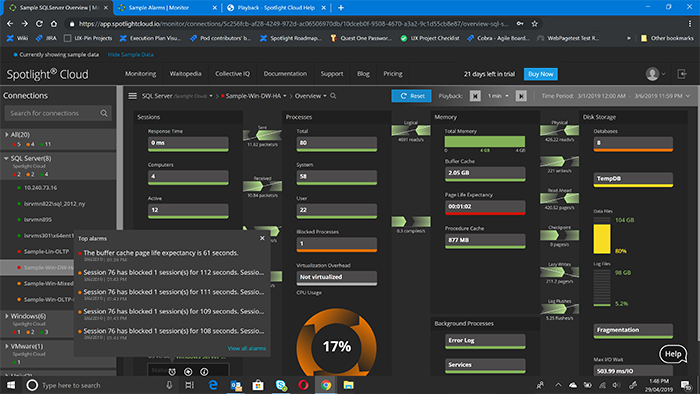
This would've resulted in slower server performance. So, I've now found at least one of the reasons for the issue the end user reported—but what caused the blocked session at this time?
Workload Analyzer Drill-Down for Powerful Insights
If I click “Diagnose” and then “Blocked Session,” I can view the Workload Analyzer drill-down and see the blocked sessions that were occurring at that time. Looking at the top right of the screen, you can see that the time range is the same as what I selected previously on the Overview page. So, I know I'm looking at the blocked sessions occurring at the time the issue was reported.
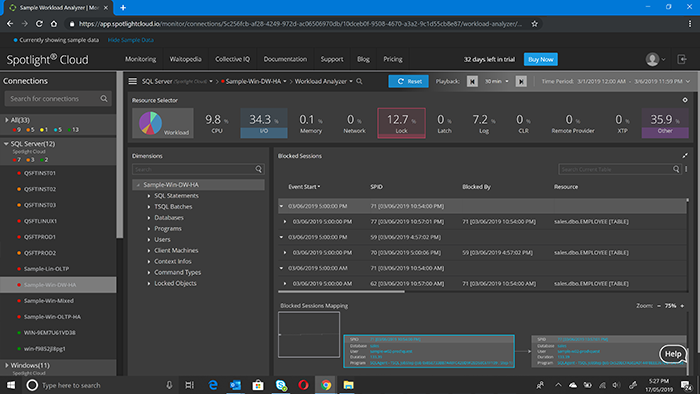
Workload Analyzer Drill-Down showing the blocked session and what it’s blocked by.
From here, I can view the details of the blocked session and what caused it. I can also look at locked objects and understand which object had the most lock wait.
I can even go another step further and drill down to see the duration of the block, the machine, program, and user that caused the block.
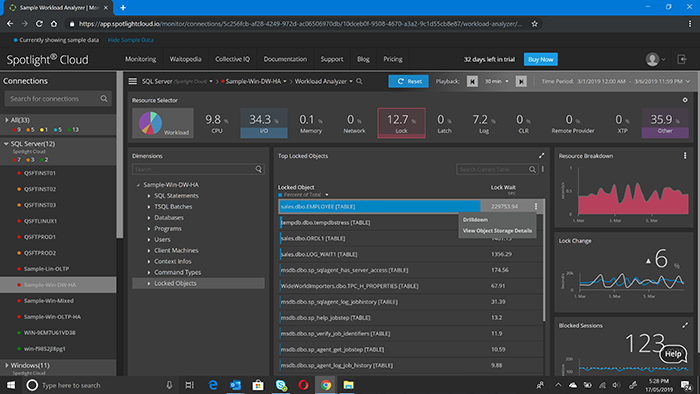
Workload Analyzer Drill-Down showing which locked object is causing the most “Lock Wait”
When I hover over the chart showing the resource breakdown (below), I can see the lock wait rate during the time range that the user reported the issue occurring. This ability to go back and identify the root cause of the problem is why this new Playback feature is so exciting.
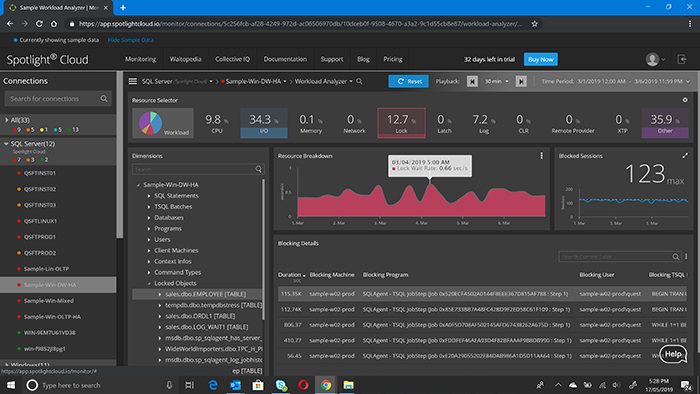
Workload Analyzer Drill-Down showing the “Lock Wait Rate” for a locked object
Now that we’ve finished with that example, I’d like to go into how you actually select a time range and interval in Spotlight Cloud. When selecting the point in time or time range for Playback, you can use the controls on the top right to customize the way Playback displays to suit your needs.
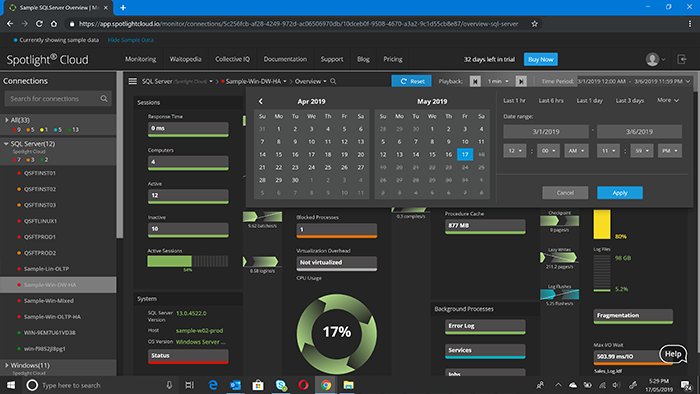
SQL Server Overview Drill-Down with “Time Period” selector displaying.
Right now, I'm viewing the time range from the fourth of March at 11:59 p.m. until the sixth of March at 11:59 p.m. If I click this rewind button, you can see the time range reduces by one minute to 11:58 p.m.
If I want to go back in larger increments of time than one minute, I can use the drop-down to change the time interval to five minutes, 30 minutes, an hour, or up to 30 days. I've selected 30 minutes, and you can see the time range end time has gone back 30 minutes to 11:28 p.m.
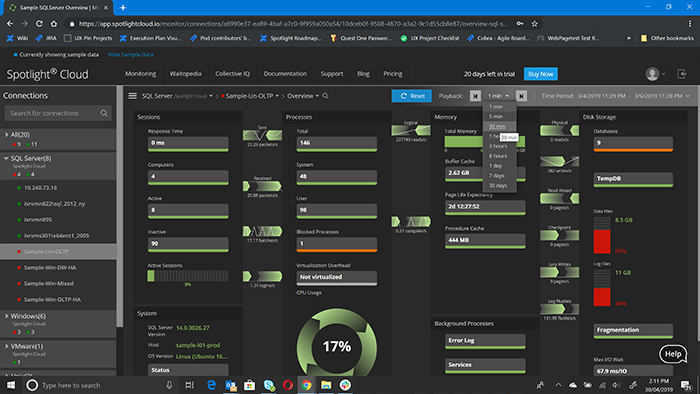
SQL Server Overview with time interval set to 30 minutes
If I click the "Time Period" options, I can select the date range using the preset options of last hour, last day, last 3 days. Or by clicking “More,” I can select the last seven, 30, or 90 days.
If, like in my earlier example, I know the time range I want to look at, then I can use the calendar to choose the dates and then select a specific time from there.
Once I'm finished, or if I just need to switch back to the present for any reason, I can click “Reset” and everything goes back to its original state.
Rewind or Fast Forward for Drill-Downs
One other point I should make is that each drill-down has a specific default time interval for rewinding and fast forwarding. The reason they vary is that for certain drill-downs, it makes sense to jump by a shorter or longer interval. An example would be sessions during which there is a lot of activity, and it makes sense to rewind or fast forward by one minute to see what’s changed each minute. However, on Workload Analyzer, where the aim is to investigate and identify issues, it's useful to see trends, and so rewinding or fast forwarding by one minute isn't as useful. That’s why Workload Analyzer has a 30-minute default time interval for rewind and fast forward.
Also, it’s important to note that when you select a time range using Playback, some metrics displayed will be for the most recent point in that time range. For example, if we look at the screenshot above, the “Page Life Expectancy” metric is 20 seconds. This metric reflects the page life expectancy on the sixth of March at 11:28 p.m.
However, other metrics, such as the “Average Wait Per I/O” on the I/O by File drill-down (shown below), display an aggregated value because it doesn’t make sense to show this data as an average from a single point in time.
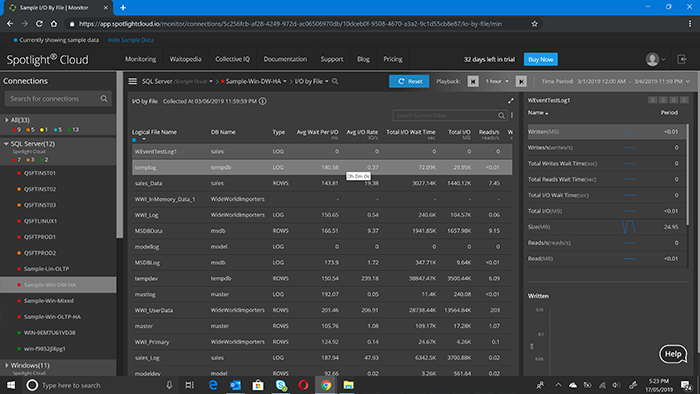
I/O by File Drill-Down
This Playback feature is available on all drill-downs for SQL Server with the exception of the Heatmap and the Health Check. Playback is also available on the Overview and Alarms drill-downs for Windows, Hyper-V, VMWare, and Unix.

Unix Overview Drill-Down