Spotlight Cloud includes over 100 defined Alarms.
Each one is designed to notify the user by triggering and displaying application alarm messages based on collected server diagnostics. The application is continuously gathering data based on its review of designated monitored servers and comparing it against a list of pre-defined thresholds in order to determine when a user notification is warranted.
That is more than 100 different checkpoints of your server around-the-clock!
The data for each alarm is collected from the monitored server at specific times based on preset time intervals. In order to provide the maximum transparency into these time intervals, their timestamp displays are scattered throughout the application. For example, they can be found in the Overview page when hovering over the monitoring metric values as well in each drilldown diagnostics page, just to name a few.
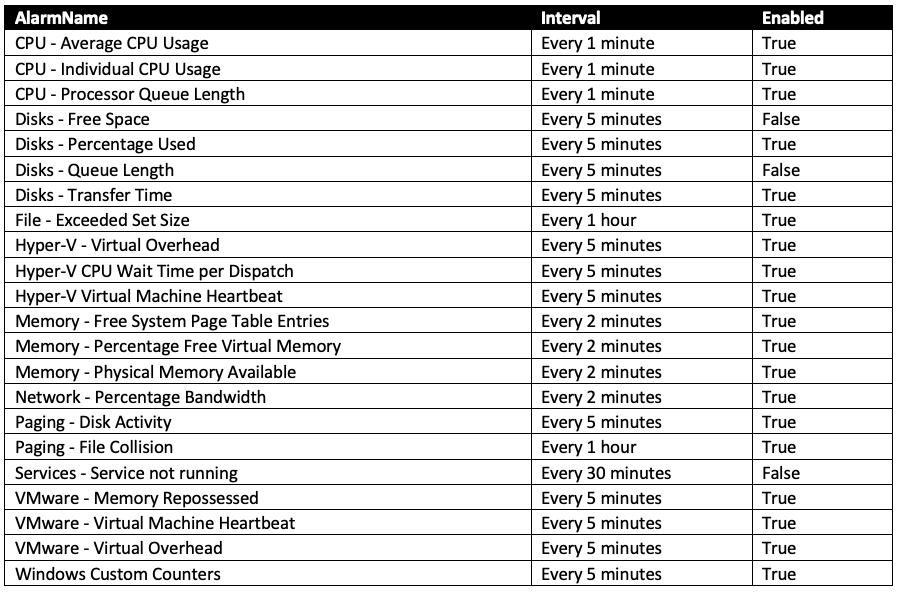
A comprehensive list of Spotlight’s alarms are presented below. The list includes the alarm name, the collection time intervals, and the alarms’ default status as delivered. The users can elect to change the alarms’ statuses as applicable to their individual requirements.
A downloadable version of this list is available in KB article 266162.
SQL Server Alarms

Windows Server Alarms
Unix Server Alarms