SQL Server blocking in a database happens when a transaction holds a lock on a resource and prevents one or more connections from operating on that same resource. The second connection must wait for the lock to release before it can continue. This is done to ensure the isolation component, of ACID – meaning that concurrent transactions are not visible to each other until they complete. Blocking in SQL Server can wreak havoc on performance in any environment.
One of the tasks database administrators do is identify the query doing the blocking, remedy it, and then go a step further to determine the root cause. Researching the root cause, especially after the fact, can be a very difficult task. For most, this means a very time-consuming process of rooting through SQL Server dynamic management views such as sys.dm_exec_requests or running system procedures like sp_who2 to find out details of the system process IDs (SPIDS) involved in the blockchain. Spotlight Cloud can greatly reduce your efforts to identify these blocking events.
Using Database Monitoring for Identifying SQL Server Blocks
|
|
| Figure 1: Overview Dashboard |
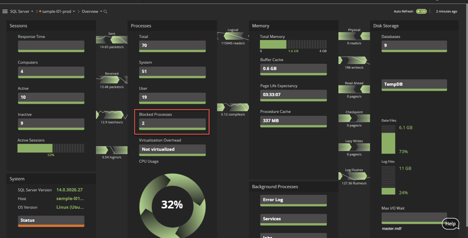
Starting at the Overview dashboard, Spotlight Cloud provides a clear view of the entire environment. It shows metrics including session counts, processes, memory usage, disks consumptions, and waits all at a glance. More importantly, it clearly shows blocking activity; in the center of Figure 1, you can clearly see that there are currently two blocked processes.
For a DBA, getting into the details is necessary for resolving blocking issues. Spotlight Cloud gives us the ability to drill into more session detail by simply choosing the drop-down menu from Overview as shown in Figure 2.
 |
| Figure 2: Dropdown from Overview |
Spotlight Cloud lets you easily see what sessions are blocked and what statements are involved. In Figure 3, you can see that SPID 59 & 65 are both blocked (indicated in orange highlight around the status), which matches the blocked count. You’ll also notice that Spotlight Cloud continues to provide summary details about our current instance state, allowing us to keep an eye on important counters while diving into performance problems.
Using Spotlight Cloud SQL Server Monitoring to Resolve Blocking Issues
|
|
| Figure 3: Sessions Dashboard |
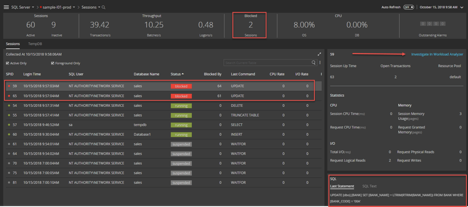
The Sessions (as seen in Figure 3) dashboard gives us vital pieces of information we need to resolve the issue. Here you can find important information like what user is running the statements, what database is affected and when the session stated. The depth of detail given is a real time saver to those DBA’s that need quick answers to what is causing blocking, so they can resolve it. You not only see that you have two blocked transitions, but we can also see that they are both UPDATE statements on the same table being run by the Network Services account against the Sales database. The actual statement is shown in the bottom right-hand corner. Lastly, we can see both the active SPID and the SPID it is being blocked by.
Towards the upper right corner of Figure 3, in blue text, Spotlight Cloud tell you where to go next in your investigation. The product within each layer gives a clear path on how to dive even deeper. Clicking on the Investigate in Workload Analyzer link lets you see what invoked SPID 61 which happens to be a lead blocker for SPID 65.
|
|
|
Figure 4: Workload Analyzer (this is where we want to expand Blocked Sessions) |
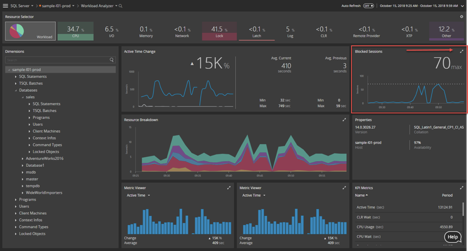
The Workload Analyzer gives you a drilldown dimension that allows you to drive into specific resources such as blocking. In Figure 4, you can see how we dive down further by clicking the two expander arrows in the corner of the Blocked Sessions section.
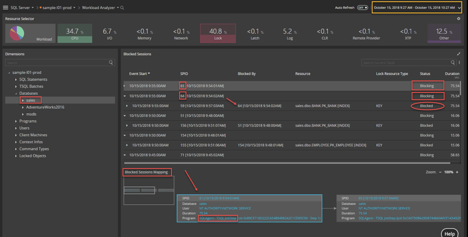 |
| Figure 5: Blocked Sessions Detail |
Now that you know the database involved, you can dig a little further. On the left navigation, you can drill into the sales database. Here you can see SPID 61 and 64 including the current status. Both of these system process IDs are blocking and notice that SPID 59 is now blocked by SPID 64 as well. This view helps to ensure that you can stay ahead of the blocking as you continue to investigate.
In the bottom half of Figure 5, you can see in the Blocked Session Mapping that it tells you the details of SPID 61, which in this case is our lead blocker. The culprit is actually part of a SQL Agent Job that is running, which makes sense based on the user we found running the statement. If you recall it was the network service account, NT AUTHORITY\NETWORK SERVICE. On this instance, the SQL Agent Service is running under this particular set of credentials.
The next step is to go find out what jobs are running and see if you can kill the job to stop the blocking. Normally you would go out to SQL Server Management Studio to review SQL Agent and to look at the jobs, but Spotlight makes it easy for you and gives you a comprehensive view of jobs as well. You can find this by clicking on the arrow next to the words “Workload Analyzer” at the top just like you did when you navigated from Overview to Sessions.
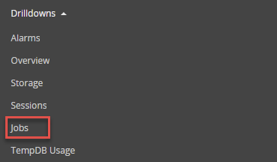 |
| Figure 6: Drop down from Workload Analyzer |
Preventing Future SQL Server Blocks
Researching blocking takes time, and sometimes, while we are researching a particular issue the blocking resolves itself. In this case, the job that was running completed and the updates that were blocked were able to run. Though the immediate problem no longer exists, you still need to keep digging for the root cause to make sure you can prevent it in the future.
Since you have already identified SPID 61 as the job that was running and because time has passed you will need to now need to look at history. To review the history, simply change the date range being displayed to the time range of the active blocking. In Figure 7, you can see the date range the right-hand corner you can click the drop down and adjusted times accordingly. Next, you want to look for SPID 61 using the search functionality. Every environment is different so what you do with this information will now depend. Whether you adjust the timing of the job, make some changes to indexes, code, or configurations will be entirely up to you.
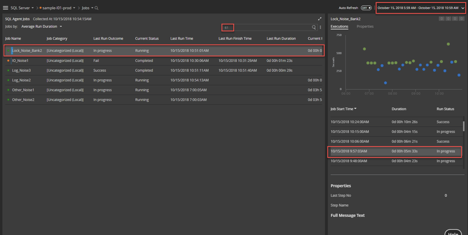 |
| Figure 7 Jobs |
 |
| Figure 8: Long running blocks |
Some blocks just come and go so quickly that they have no significant effect on performance. When they do stick around longer we need to know about this fast. Spotlight Cloud has a “long running lock” alarm that notifies the user of blocks that are not going away.
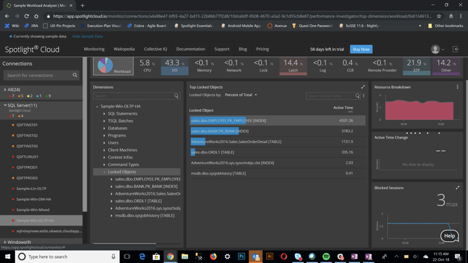 |
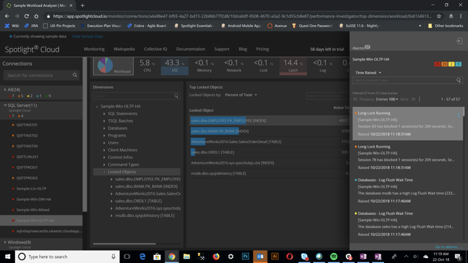
| Figure 9: Blocked object dimension |
Blocking is a symptom of some bigger issues and it often takes different perspectives to arrive at the root cause. The blocked object dimension in Spotlight Cloud workload analyzer allows the user to quickly ascertain objects that are generating the most blocking activity for a given instance.
Identifying blocking and digging into the cause is the hardest part for DBAs. Spotlight Cloud Professional allows us to get to this information quickly and efficiently. When time resolves the active issue, Spotlight Cloud allows us to keep investigating to get to a root cause and ultimately gives us the information we need to make informed decisions on how to prevent future occurrences.
Want to see Spotlight Cloud in action? Start your free 30-day trial today.