Is your server suffering from an excessive number of I/O alerts? If so, should you be worried about server performance degradation? How to best diagnose the underlying issue and smash I/O bottlenecks?
The I/O Stall Time Alarm of Spotlight Cloud is a good indicator of I/O bottlenecks. It gets raised when the average wait time per operation of a database file exceeds the alarm threshold. The alarm utilizes data from sys.dm_io_virtual_file_stats DMV’s for its computations. It uses an average value derived after five collections over the last 15 minutes so you won’t be alerted on an occasional spike. Alarm description includes the database virtual file name, database name, and average amount of wait time per I/O operation.
Four easy suggestions to diagnose I/O related issues in Spotlight Cloud:
1. Check what is contributing to I/O consumption.
I/O consumption is a sign of disk subsystems latency that could be caused by memory or CPU pressure, poorly written queries, or not having a good mixture of indexes. At the time of the alarm:
First, take advantage of the Properties right-side panel of the Alarms page to view Smart Alarms related data:
1. Details of the alarm including the file name, average I/O wait time on the file, and duration of the alarm
2. Analyze the collected data graphed on the trend chart spanned over last few hours
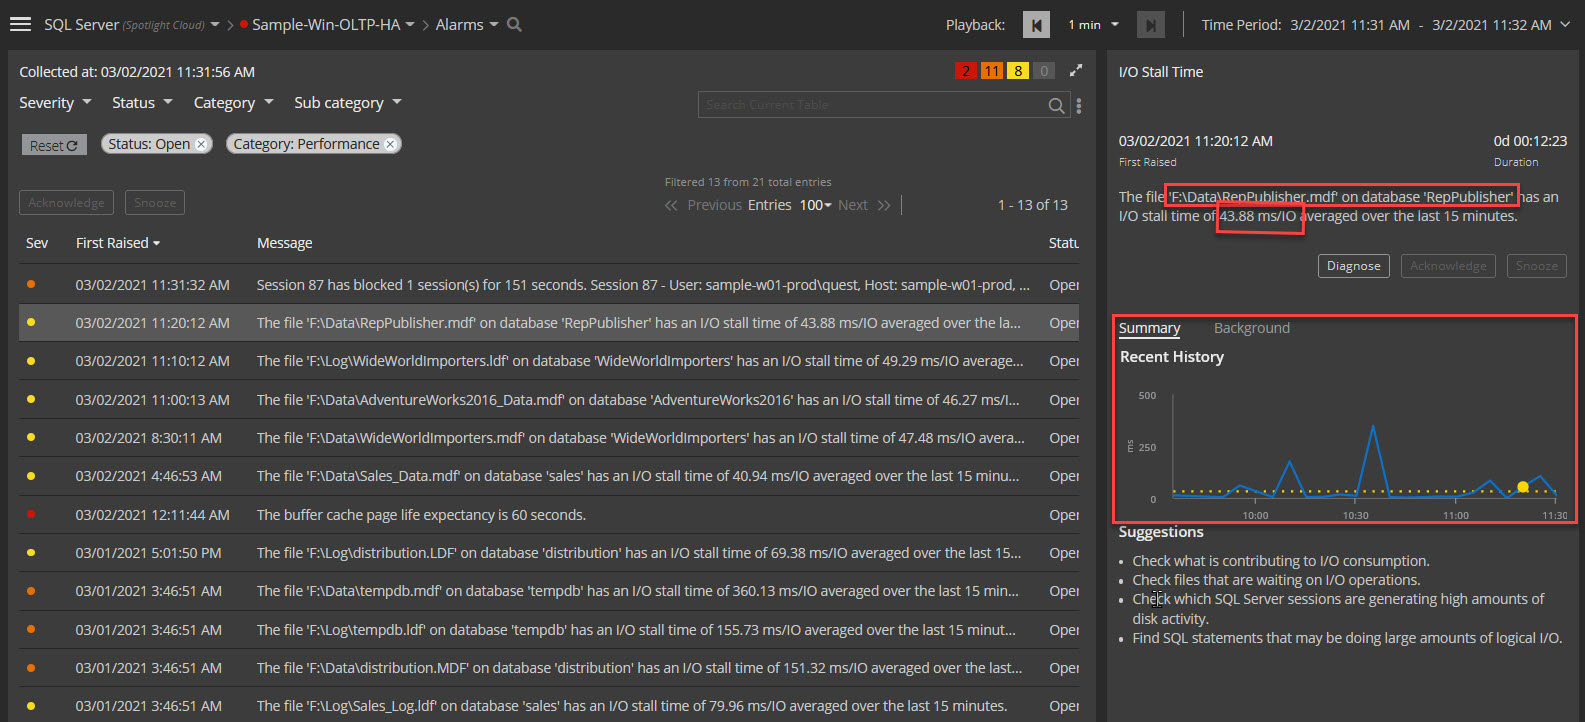
Next, diagnose the issue by pressing the Diagnose button. That will lead you to the I/O by File dashboard focused on the stressed file. You can use this and other dashboards to diagnose further:
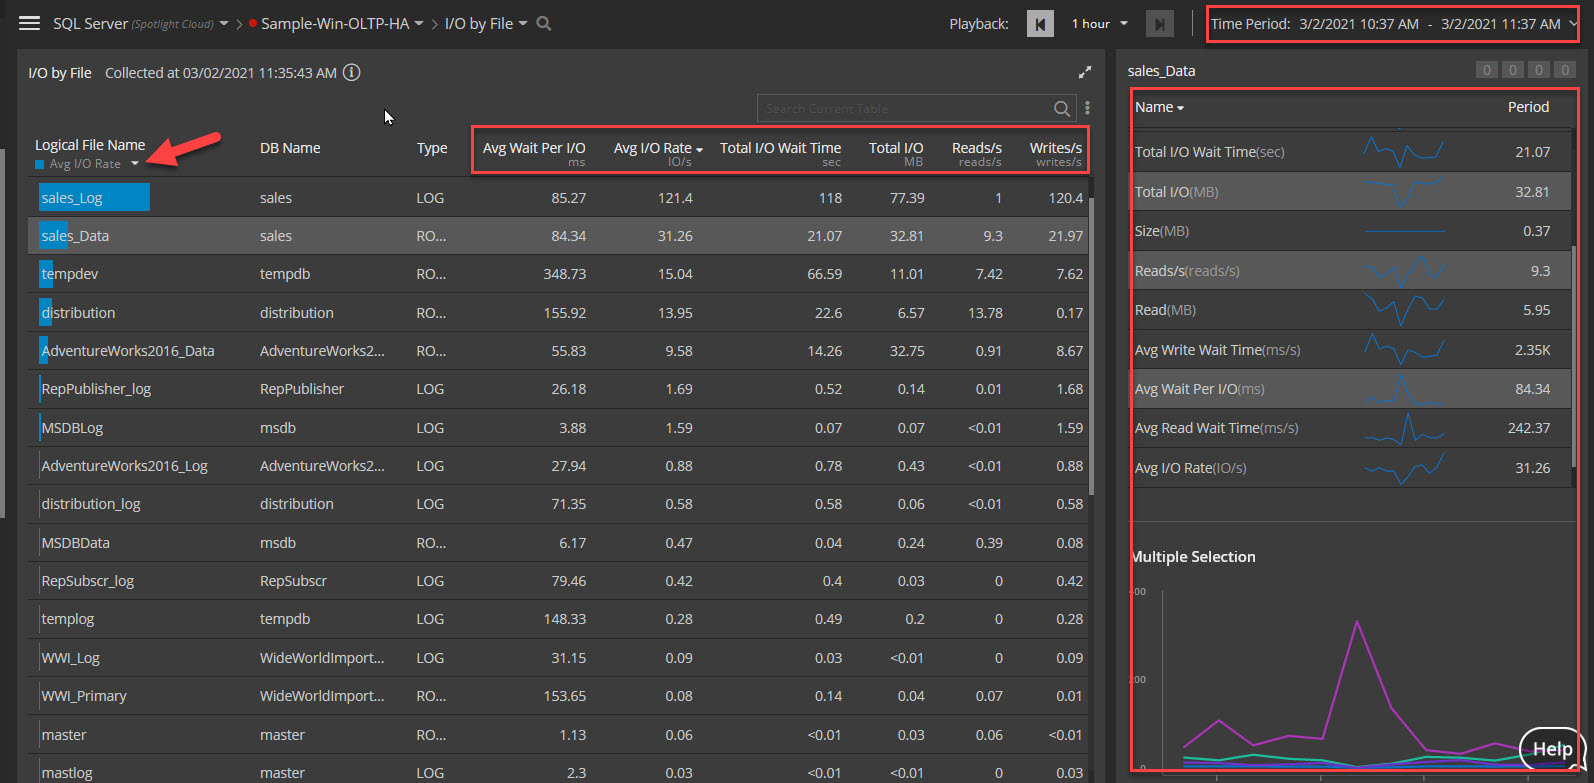
1. I/O by File – Identify the files directly affected by I/O
2. Workload Analyzer - The top SQL statements and TSQL batch consuming the most I/O
3. Sessions – Sessions at the point of time with disk activity
4. Health Check - Review if there are missing indexes
2. Check files that are waiting on I/O operations.
The I/O by File dashboard identifies the files waiting on I/O operations. Examine the following I/O statistics:
1. Take a note of the I/O related columns: I/O Rates, Reads/Writes Rates and Wait Rates
2. Sort the files by their avg wait per /IO by pressing on the blue drop down list directly above the Logical file column.
3. View the Read and Write activity in the last hour generated on the file shown on the panels on the right.
4. Optionally, expand the timeframe to check if this is a normal behavior on the file.
5. Should you see a number of files over time suffering from the same problem and share the location or disk, consider adjusting their location and compare the IO contention between disks or locations to alleviate the disk latency issues.
6. In case Tempdb database files are a prominent factor, use the TempDB Usage dashboard to view the activity against the database:
a. Tempdb database files and their stats
b. Sessions utilizing tempdb
c. Top tables and indexes created in tempdb 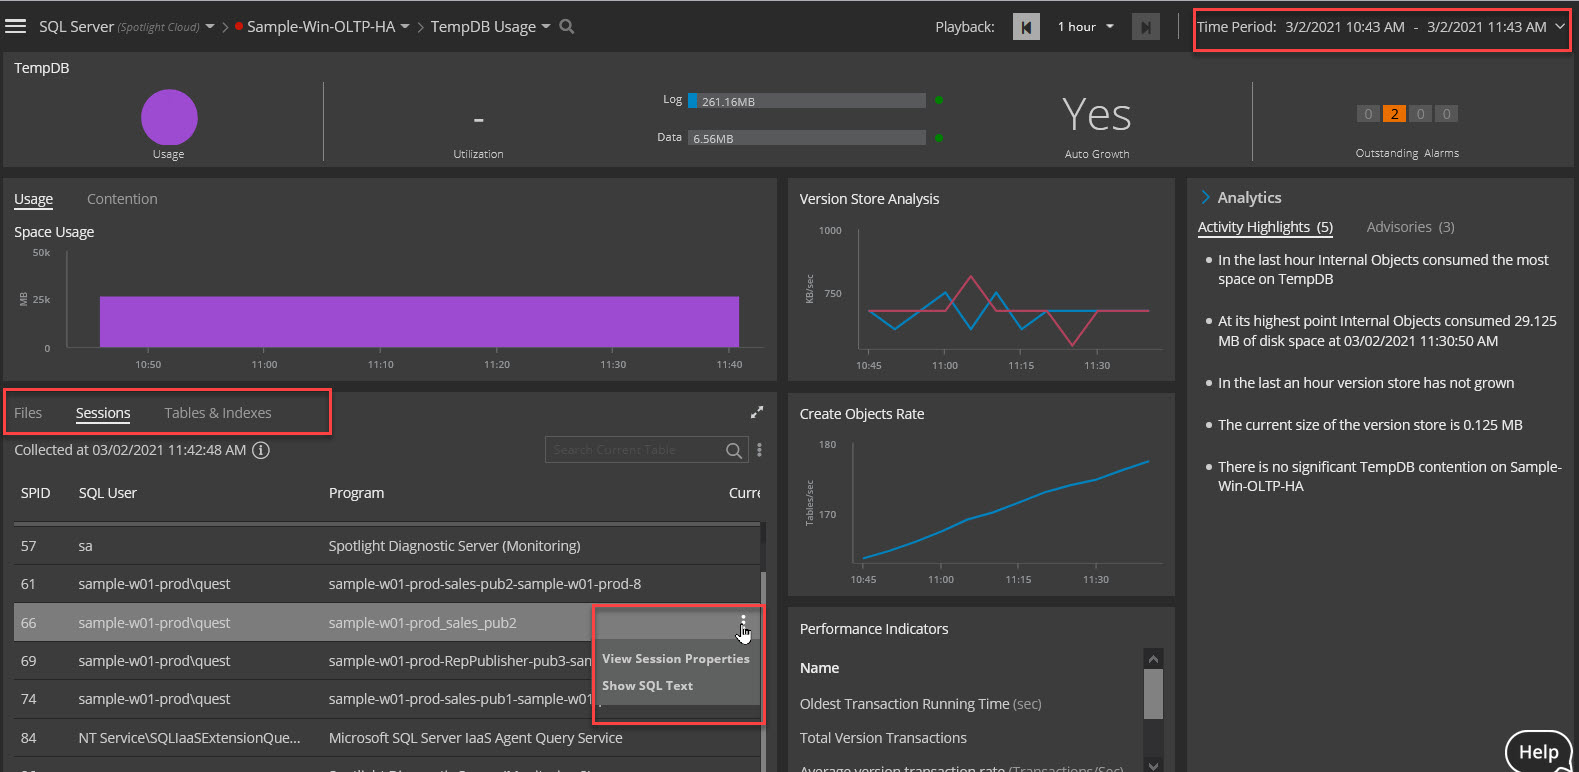
3. Find SQL statements that may be doing large amounts of logical I/O.
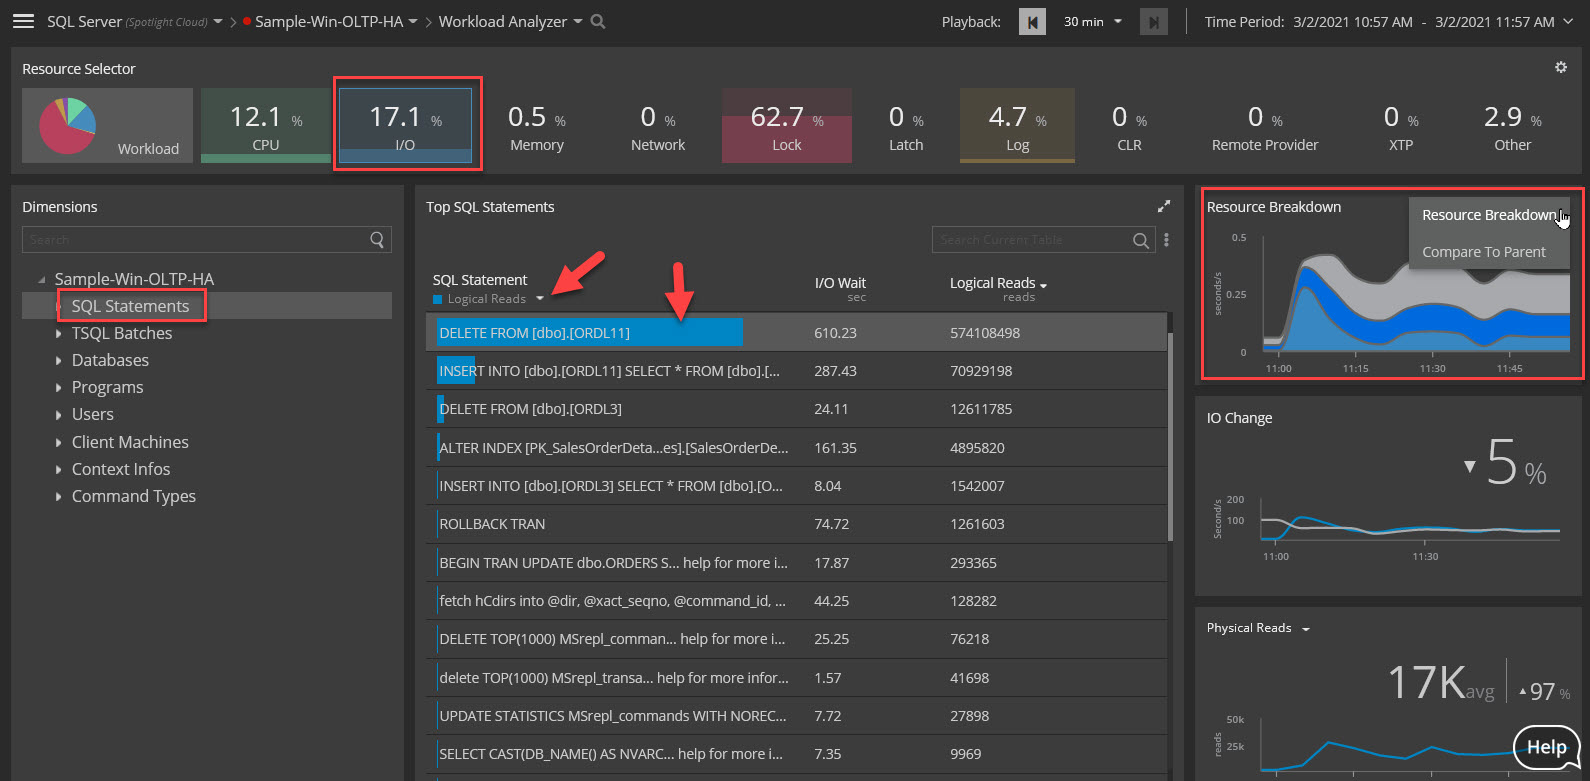
The Workload Analyzer dashboard shows the top I/O consuming SQL:
1. Click the I/O resource at the top banner and expand the SQL Statement node from dimensions tree to view the top 25 SQL consuming I/O during the time period.
2. Focus on one statement and expand the SQL Statement Properties panel on the right side to view the details of the SQL and query plan.
3. Load the SQL statement in SSMS by using the ‘Open in SSMS’ option and use Tuning Pack plugin tool to analyze the plan or have it rewrite a more optimal statement.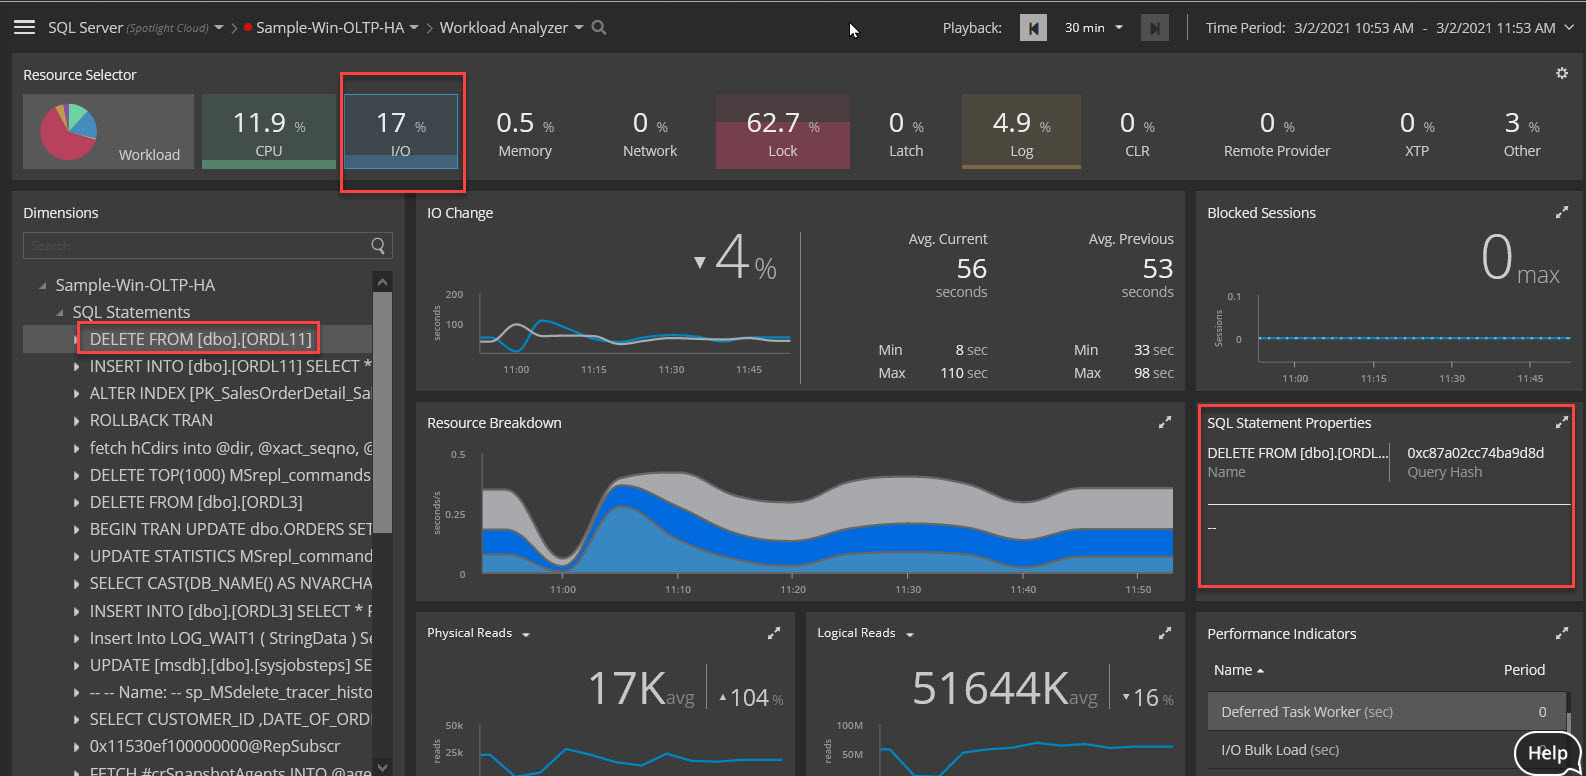
4. Focus on the ‘SQL Statement’ node of the Dimensions tree to list the SQL statements. Sort the sessions by IO Wait or Logical Reads. Use the Compare to Parent panel on the right to compare the IO wait of a single SQL to the rest of SQL in the instance taking up IO. The logical I/O may result in unnecessary physical I/O.
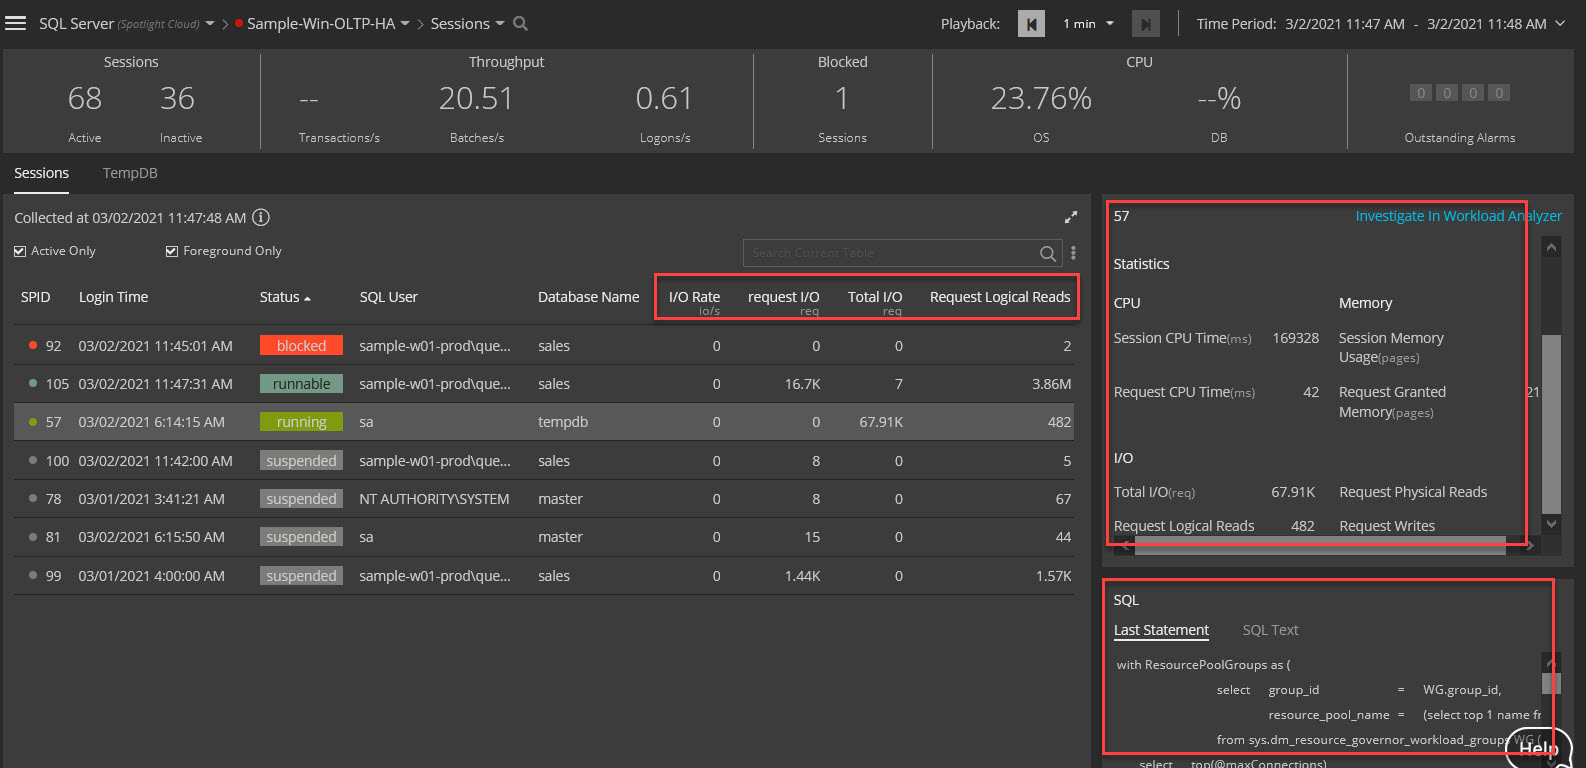
4. Check which SQL Server sessions are generating high amounts of disk activity.
The Sessions dashboard shows the sessions open in the instance. To see the sessions that are generating high amounts of disk activity, check the I/O related stats and sort by them.
1. I/O related stats point you in the right direction: Total I/O, Logical Reads, Physical Reads, and Request I/O
2. The right-side panel of the Session tab shows additional stats along with the underlying SQL
Use the Tempdb panel to view sessions utilizing the Tempdb database:
1. Use the Tempdb dashboard to identify the sessions and objects utilizing the database
2. Use the Tempdb Usage dashboard to see all sessions over a period
Take charge of I/O latency by leveraging the Spotlight Cloud diagnostic capabilities!