While we all know locking is essential to data integrity, it doesn’t change the fact that it can be a serious thorn in your side!
When we see blocking in our database, we often assume something is wrong – that’s not always the case. In my experience, the majority of SQL Server blocking is legitimate, but it needs to be investigated and understood. Deadlocks, on the other hand, are rarely legitimate! Deadlocks are considered critical in the SQL Server world because processes get killed automatically, as SQL Server resolves deadlocks without requiring manual intervention. Again, even though they are “resolved”, they definitely need to be investigated and understood.
There are a few design strategies that can help reduce the occurrences of SQL Server blocking and deadlocks in your database:
- Use clustered indexes on high-usage tables
- Avoid high row count SQL statements
- Break up long transactions into many shorter transactions
- Make sure that UPDATE and DELETE statements use indexes
- Don’t schedule batch update jobs to overlap
- Keep your stats up-to-date
And I’m sure there are many more, but the reality is you can follow all the best practices you can think of and still have blocking and deadlocks. This is because, in most cases, deadlocks are caused by poorly designed application code. (The rabbit hole of application design: coding, transaction isolation, and access patterns. But for now, let’s focus on investigating and understanding blocking and deadlocks).
SQL Server Blocking and Deadlocks
The first challenge with blocking and deadlocks is to identify when and where they are happening because they are usually not reported, reported after the fact, or resolved automatically. To get a real understanding of what’s happening in your database regarding blocking and deadlocks, you need to see their occurrences over time. Also, in order to rectify the issue and stop future occurrences, you need to get to the root cause of the blocking–arming yourself with information you need to relay back to the application developers and thus putting an end to the blame-game between Devs and DBAs.
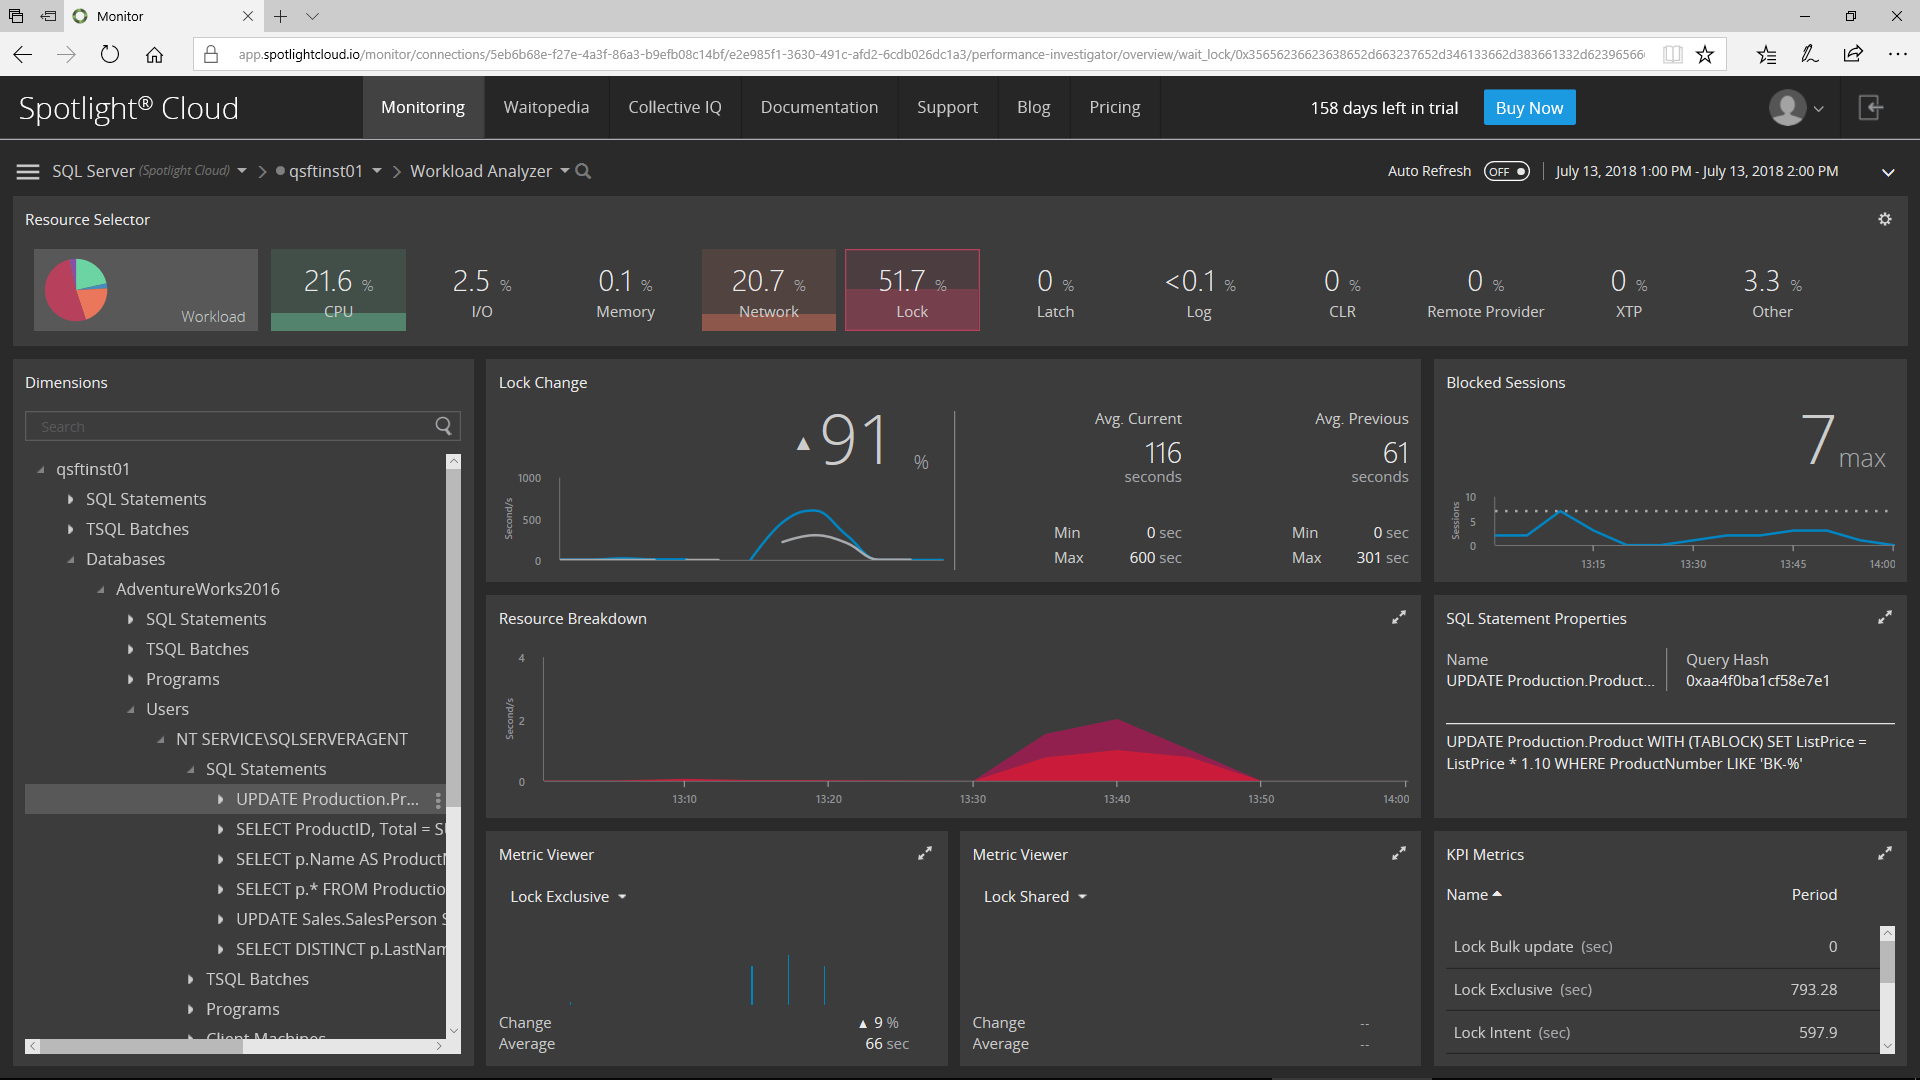
This is why I really like the Workload Analyzer in Spotlight Cloud. I can select a time range – an hour, a day, or a custom range – and view the Lock-related activity for that range. Straightaway, I have a better understanding of what’s going on! I can see locking patterns, compare the rate of locking over time against a previous time-range, see the rate of blocking over a specific time frame, and view locking KPIs such as Lock Exclusive, Shared, & Update.
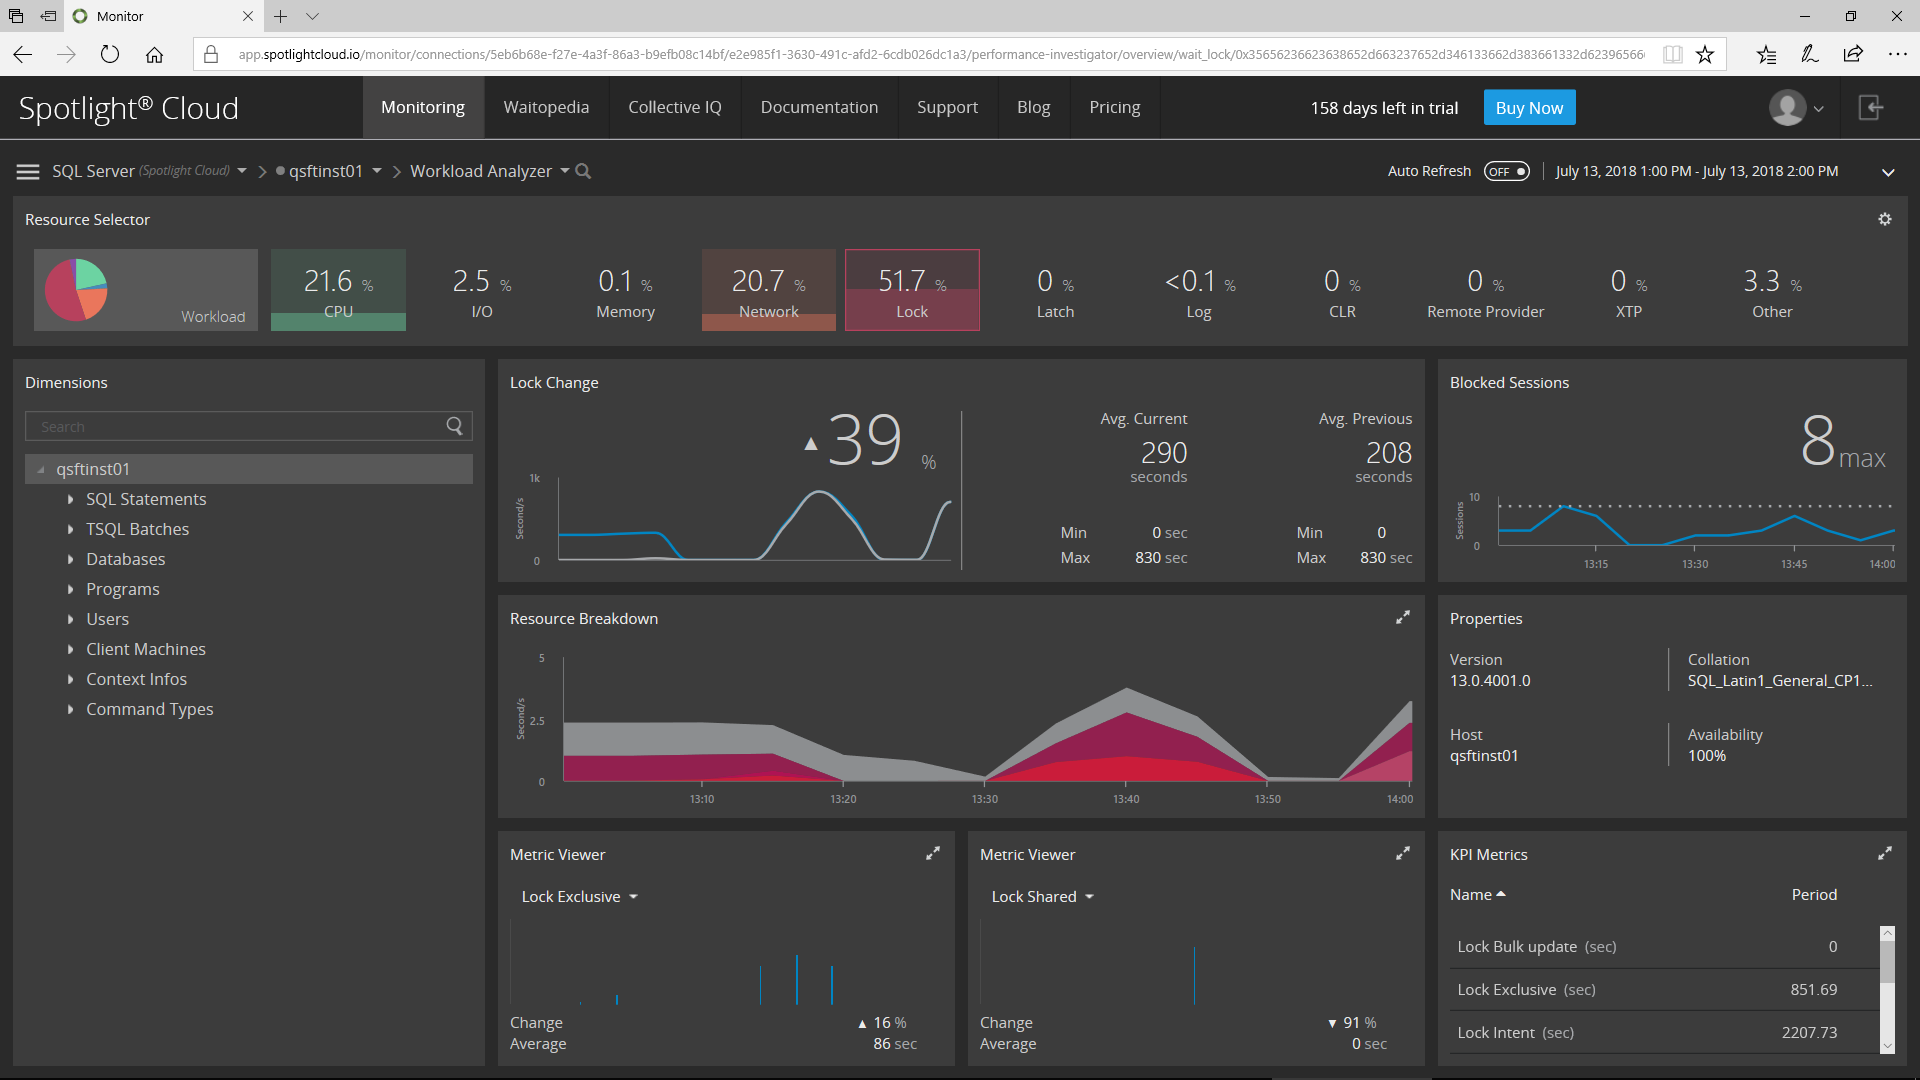
So now I want to get to the root cause – that’s where Dimensions Tree comes in. I can drill down and filter the information for a specific time frame, allowing me to see the same information at deeper dimensions such as Databases, Users, Programs, and SQL Statements, while filtering out the “white noise” as I go – clearly identifying the source(s) of my issue.
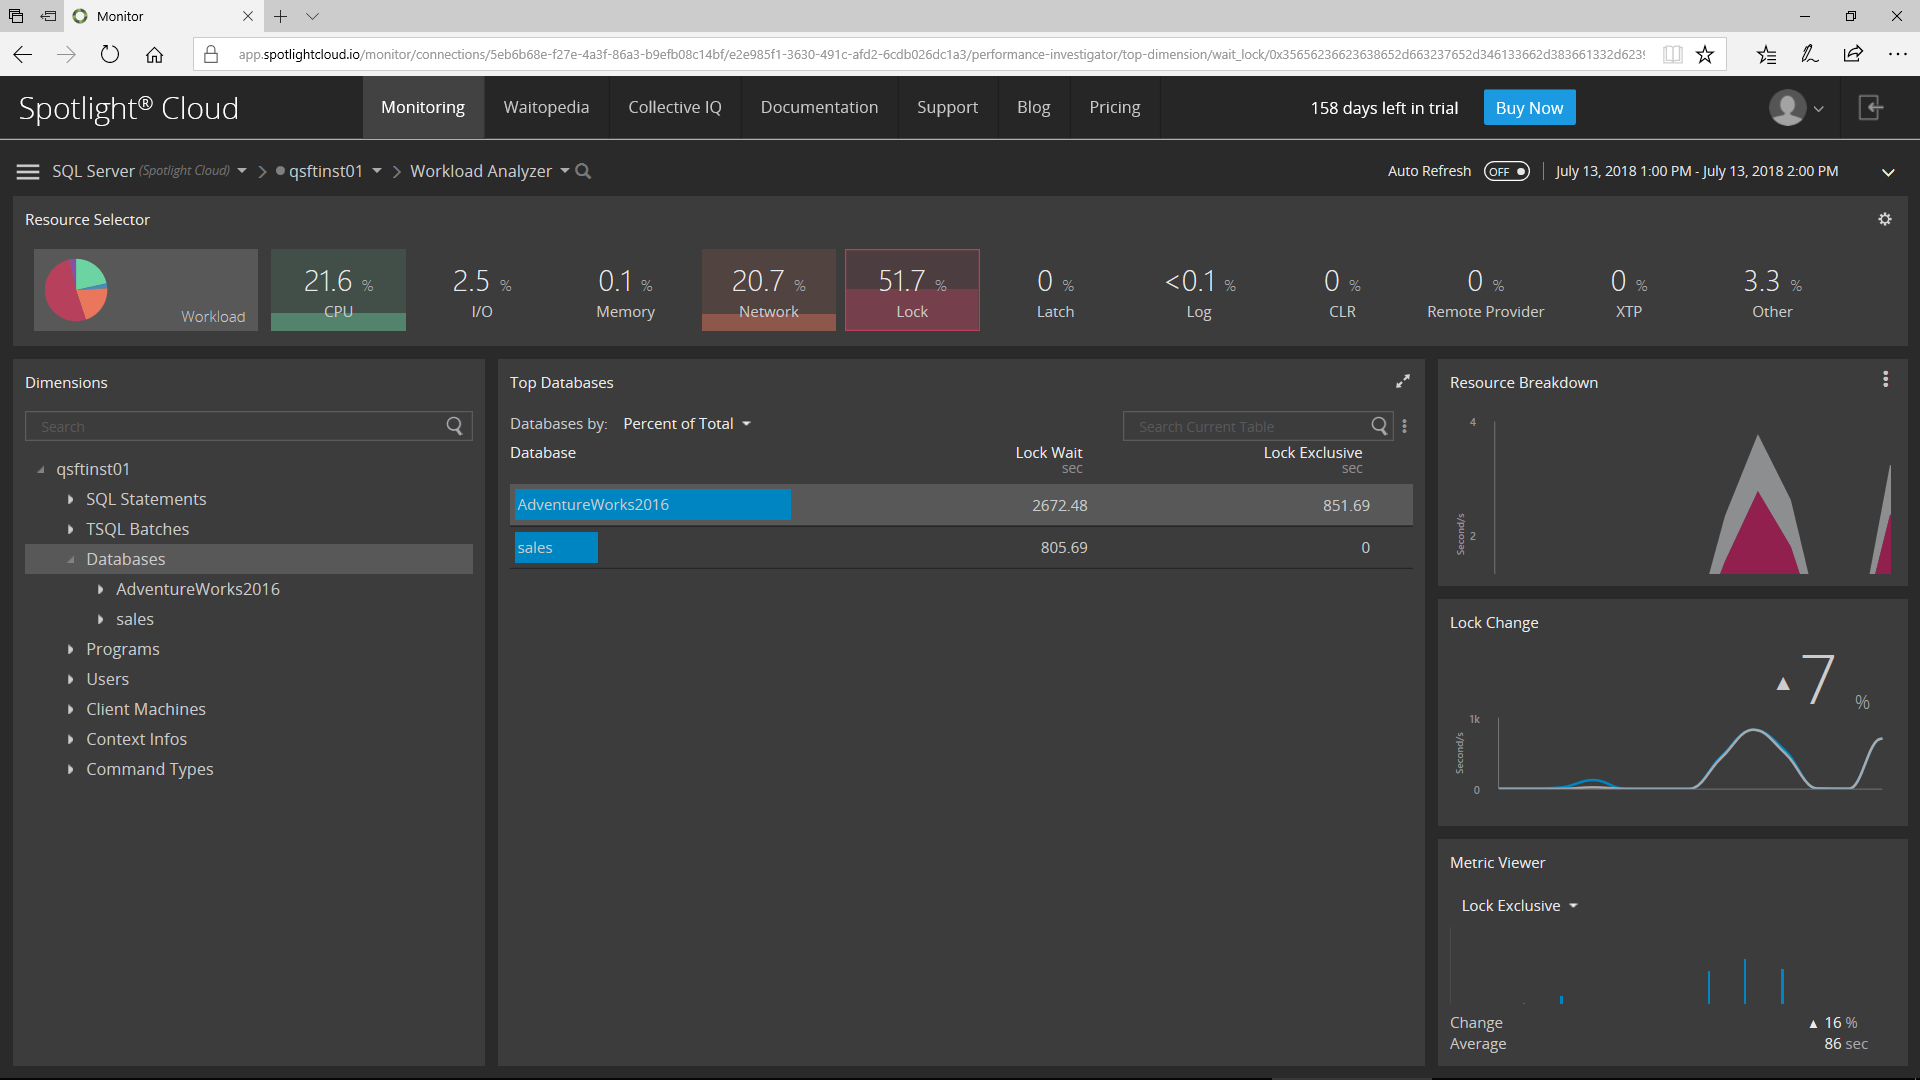
Here I’m looking at which Databases are experiencing the most locking during the time range:
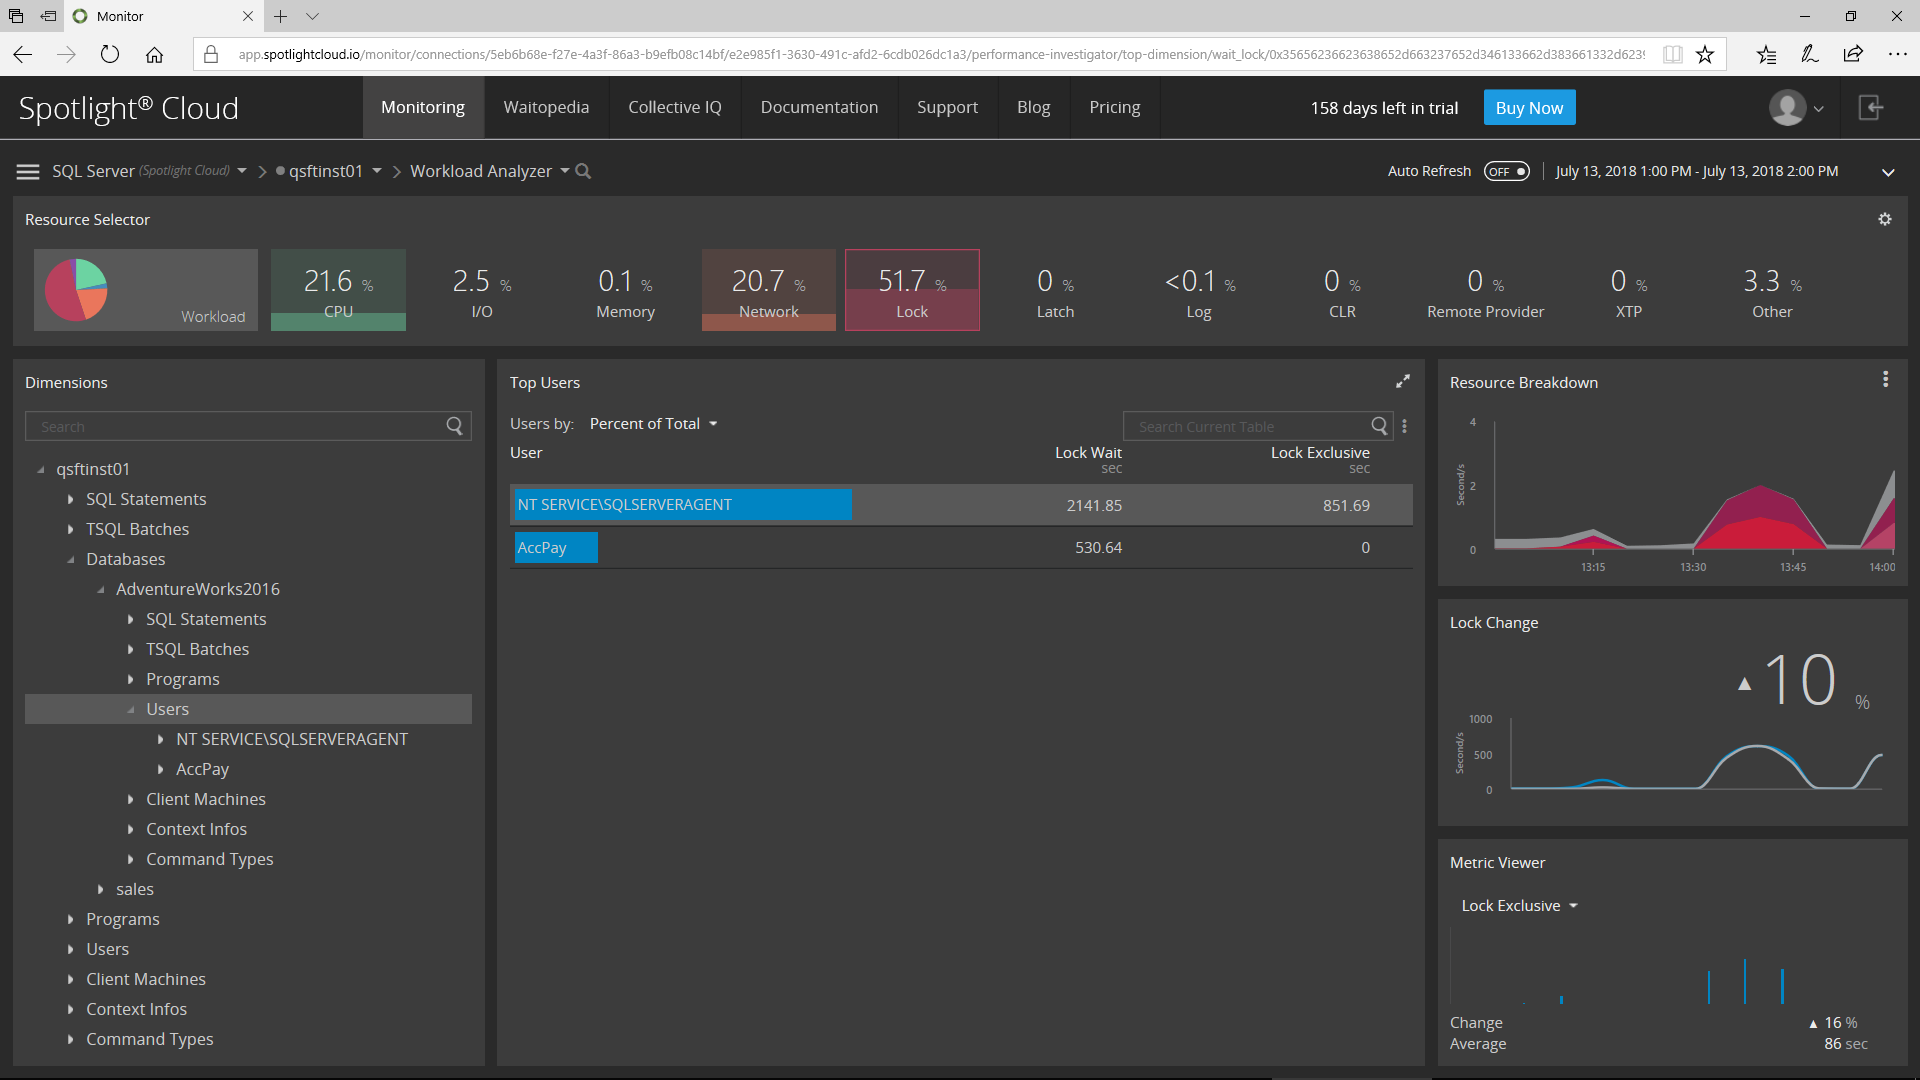
Now, I’ll drill down on the Users within the selected database:
Then, I’ll choose to see the list of SQL Statements causing locking that was executed by the selected User in the selected Database for the specified Time Range.
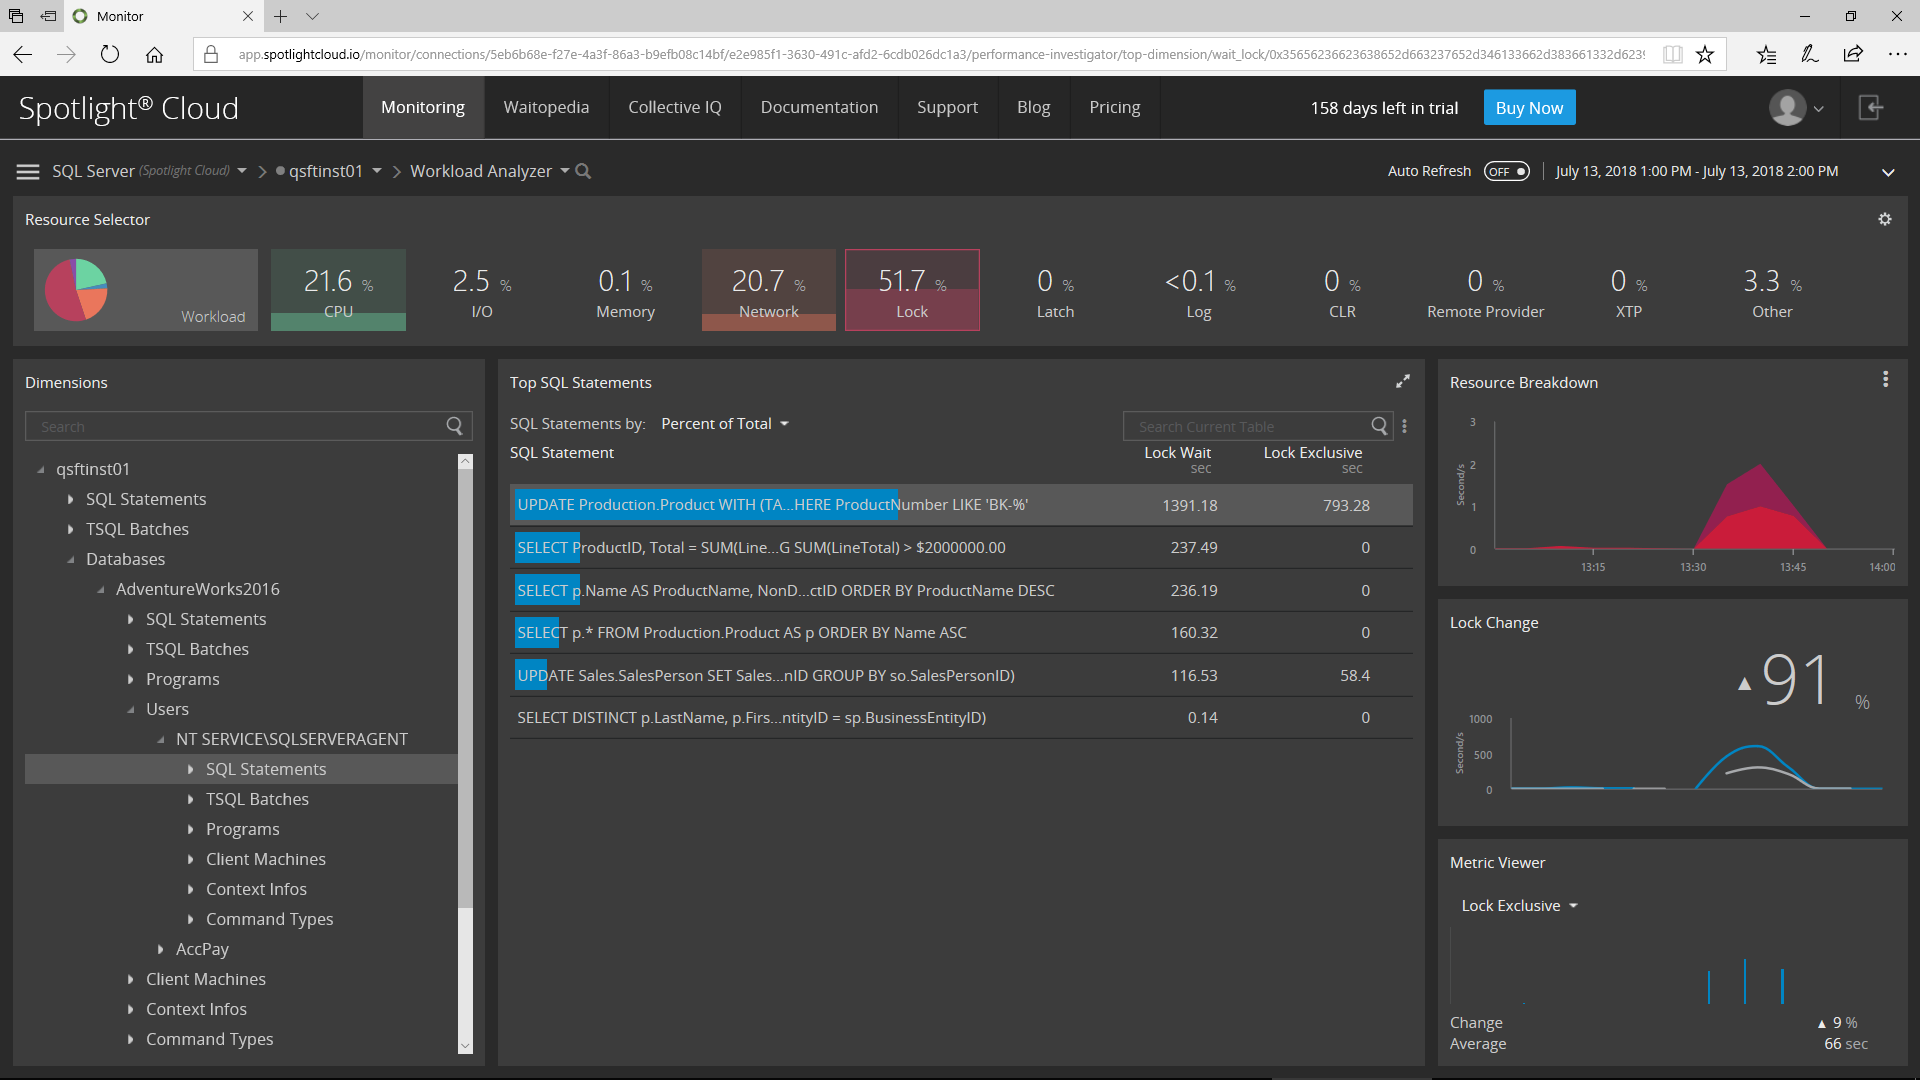
Now, I can see all the Locking related information for the selected SQL Statement.
So if you want to get to the bottom of your locking, blocking, and deadlock issues, I recommend that you check out Spotlight Cloud. Spotlight Cloud makes it easier than ever to investigate and understand the locking issues within the database and ultimately ensure that your application code is deadlock-free.