Sign in

Chapters

1

Getting to Know Your SQL Server Workload

1

Choosing a SQL Server Monitoring Tool to Suit Your Needs

1

Some Key SQL Server Metrics to Watch

1

Find and Fix the Performance Bottlenecks

1

Using Performance Data to Drive Flexibility and Innovation!

SQL Server performance monitoring illustration on a computer monitor

1

Getting to Know Your SQL Server Workload

Once you have established a list of SQL Servers in your environment, you will want to ask some critical questions:

  • How healthy is this instance?
  • When is the last time it was backed up?
  • Does it have sufficient CPU, memory, and storage to meet its SLA?
  • What kind of workloads run on this instance?
  • What applications and users use this instance?
  • What kind of I/O activity does this instance see over time?
  • When is the workload at its busiest?
  • What kind of performance challenges does this instance have?

These may seem like obvious questions, but if you start monitoring your workloads for the first time, you will be surprised and possibly a little horrified to see how many of them have fundamental issues.

Think about what you want to achieve from your monitoring efforts and prioritize these goals. By framing your activities in terms of key performance indicators, it becomes easier to articulate the value of the effort and any investments required.

There are many influencing factors when it comes to database performance. Knowing the normal fluctuations of your particular instance helps you to identify when behavior is trending out of control and to anticipate problems before they occur. It also helps you to distinguish between what are natural growing pains caused by increased workload or seasonal spikes that may just require more resources versus deeper performance issues that require code tuning, index optimization, or configuration tuning. Monitoring many different metrics in parallel helps to accurately identify the root cause and avoid expensive misdiagnosis that can cause a repeat or even escalation of the same issue.

Read more in our blog article, “Getting to Know Your SQL Server Workload."


DBA Resources

Spotlight-Top3-Trends-Blog-header

Top Three Trends Affecting SQL Server DBAs

Spotlight-Customize-Alarms-header-V2

Customize Spotlight Cloud Alarms

Spotlight-Collection-Schedule-blog-header-V2

Spotlight Cloud Alarms Collection Times

Upfront Infrastructure Costs of Database Performance Monitoring

2

Choosing a SQL Server Monitoring Tool to Suit Your Needs

Before you start to look at tooling, think about your specific environment. It is important to understand your environment and what you need to get from a performance monitoring system. 

There are many considerations when choosing a tool that best suits your needs. With so much data available in SQL server via DMVs, XEvents, and traces, rolling your own can seem like a great idea—but very soon, you will realize just how complex this can be. Free tools can give smaller organizations or dev teams a great head start, but often they are limited or not truly free with expensive storage costs and high maintenance.

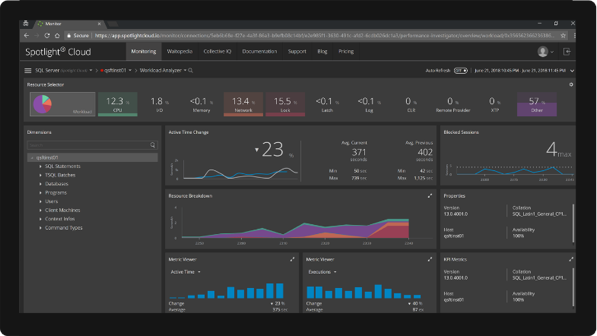
A good performance monitoring systems tracks a broad range of metrics at a frequency that gives you the insight you need and with enough history to get insights from key trends. This generates a considerable amount of data, which needs to be hosted in a data repository and needs systems for analysis and reporting. 

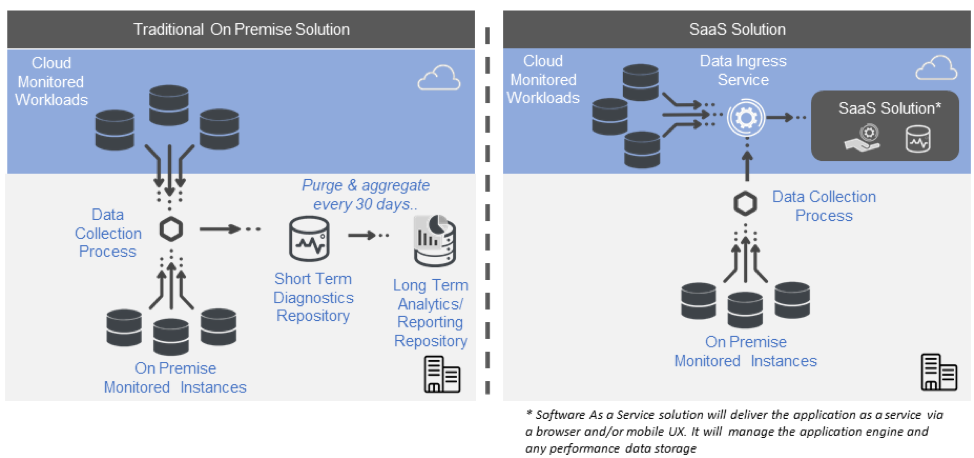
As you consider the type of system that best suits your needs, it is good to understand the moving parts of a typical monitoring system These vary from a traditional on-premises solution to a software as a service (SaaS) solution. Considering the architecture will allow you to assess the total cost or ownership and match this against your budget and spending patterns.

dbblogpic1

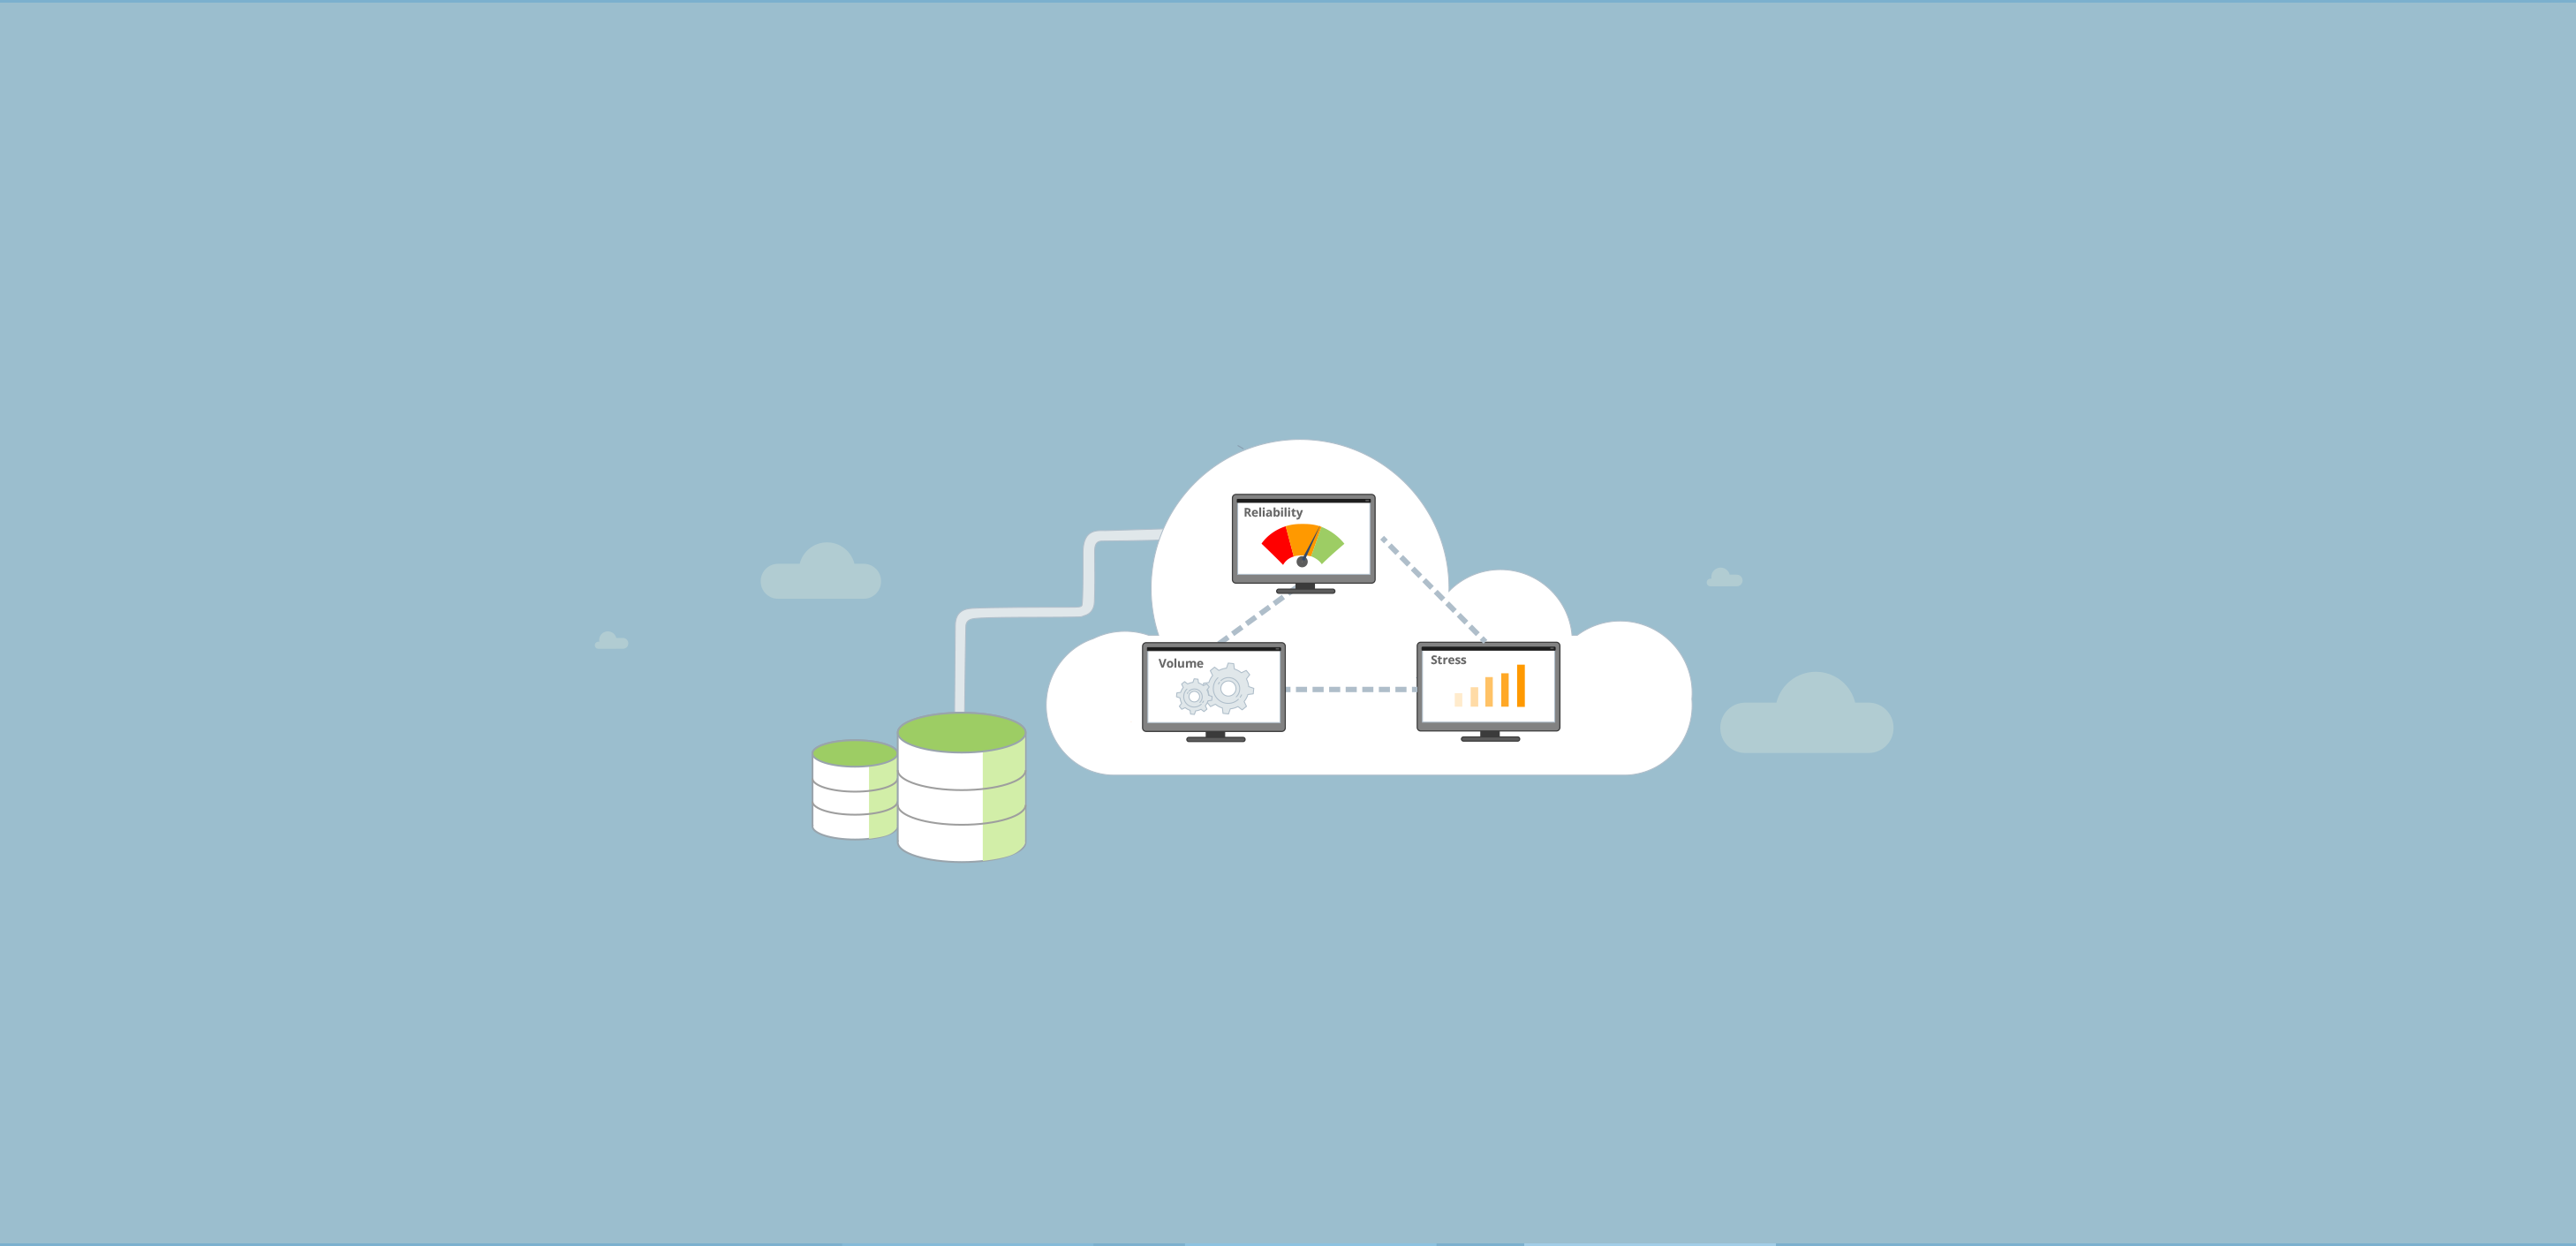
Finally, there are key functional groups to consider. Watch out for the features that will deliver the best results in the most efficient way and those that will return the greatest insights.

Find out more in our blog article, “Choosing a SQL Server Monitoring Tool to Suit Your Needs."

DBA Resources

Spotlight-Cloud-Migration-Blog-header

Spotlight Cloud Migration Plan

Spotlight-Cloud-Migration-header

Is everyone migrating to the cloud? If so, why? If not, why not?

DBA-Value-Blog-header

How to Articulate Your Value as a DBA in Terms Even the CFO will Understand

Eliminate server downtime with quality database performance monitoring

3

Some Key SQL Server Metrics to Stay Ahead of the Game

One of the things to love about SQL Server is the number of useful metrics it generates. It’s also one of the things DBAs find challenging. Trying to determine which metrics to monitor closely to avoid performance issues is time-consuming, and most DBAs are pretty busy already. The list below singles out some of the higher-impact areas. 

The pulse—CPU and I/O

CPU and I/O are the fundamental building blocks of any workload. It is important to distinguish between SQL Server’s consumption of CPU versus what is made available by the host. The collection frequency of CPU and I/O should be every few seconds. Looking at variation over time and stacking the metrics relative to each other is important to understand how they interrelate. 

Buffer cache

The buffer cache is the first place SQL Server looks for recently used database pages. If a page isn’t there, SQL Server searches the disk, which slows performance way down. You can specify the amount of memory to allocate to buffer cache, but the trade-off is that there is less memory available for other functions, which also affects performance. Monitor these metrics to help you decide how frequently to evict pages and when or if to increase the size of the cache:

1. Driving performance—indexes

SQL Server performance can be significantly impacted by the addition, removal, and maintenance of indexes. Once they are created, indexes must be maintained. A poorly maintained index can hurt your performance rather than enhance it. Fragmentation and page splits are inevitable and can hurt query efficiency. Keep track of your SQL Server index health by monitoring fill factor, I/O, and fragmentation.

2. SQL statement compilations

SQL Server streamlines performance by batching SQL statements, then compiling them as an execution plan and caching them. Ideally, execution plans can be reused to avoid having to recompile plans, a process that uses a ton of CPU and degrades performance. Good coding practices can help DBAs avoid having to compile and recompile execution plans. 

3. Locks and blocks

Though blocks are a necessary safety feature, getting locked out of a database you need to access is a productivity killer. Monitoring lock waits and numbers of blocked processes will help you determine how often and how widely operations are being affected by locking.

Related Reading: SQL Server Performance Metrics to Stay Ahead of The Game

DBA Resources

SQL-Server-Performance-Testing-Blog

SQL Server Performance — Testing in the Cloud

SQL-Server-Performance-Metrics

SQL Server Performance Metrics to Stay Ahead of The Game

BottleNeck-Blog-header

Talking About SQL Server Performance Bottlenecks

Visualize your SQL Server performance monitoring data efficiently

4

How to Find SQL Server Performance Bottlenecks

SQL Server bottlenecks can occur almost anywhere for a million different reasons, including:

Performance issues can manifest as using too much memory, long wait times, index fragmentation, too many or too few indexes, among other symptoms.

In a DevOps world, we need to balance our performance remediation across more developer-related fixes, such as design, code tuning, or plan optimization, versus database engine configuration and optimization. There are many ways to improve our performance before taking on more expensive options such as adding hardware resources or, worse, consuming more cloud resources.

Related Reading: Talking About SQL Server Performance Bottlenecks


DBA Resources

Plan Caching - Reuse-1

SQL Server Internals: Plan Caching Pt. I – Reusing Plans

SQL Server Internals Plan Caching Pt. II – Recompiling Plans

SQL Server Internals: Plan Caching Pt. II – Recompiling Plans

Optimizing TempDB

Optimizing TempDB

FullStack

5

Using Performance Data to Drive Flexibility and Innovation!

Now that you have your SQL Server performance monitoring strategy in place, it’s time to look ahead to what’s next. Today’s DBA is primarily focused on control and administration, i.e., thinking about things from a release process and management perspective. But as the market heads deeper into agile- and DevOps-driven environments, the DBA role will have to adapt to keep pace.

In the near future, your focus will become less about management and control and more about enabling, collaborating, and working with the business and development teams to innovate faster and to enable the innovation process.

There are several trends to watch in the short term that are driving the long-term outlook for SQL Server DBAs: 

SaaS

More and more, organizations are aiming to be “SaaS only” organizations. A recent IDC study predicted that public cloud services spending would reach $160B by 2018. More importantly, the study predicted that 73 percent of organizations will have the majority of their workloads on SaaS by 2020. There are good reasons for doing this. For one thing, it means that organizations can stop trying to be data centers by managing their own infrastructures. Subscription-based billing models do away with big up-front fees and spread the cost more manageably over time. Now organizations can concentrate on building, modifying, and maintaining applications built specifically for them.

Cloud—database as a service

Microsoft is big on moving to the cloud. They are even moving SQL Server database upgrades to cloud databases, including Azure SQL DB, Azure Managed Instance, and Cosmos DB.

Microsoft also offers capabilities for open source support, such as for Cassandra, Postgres, and MySQL. This cross-platform push is being driven by increased Azure consumption and the trend toward moving infrastructure, applications, and databases to the cloud.

APIs

You may have noticed that Microsoft is really pushing the APIs. What does this mean for you as a SQL Server DBA? Essentially, the way you’ve always interacted with SQL Server using T-SQL is being replaced with an API-oriented interface.

The ability to interact with the database from an API perspective and the ability to move data back and forth using APIs is a big trend for SQL Server DBAs to watch.

Mobile

Mobile technology is no longer a trend for DBAs; it’s a critical tool in their daily work. Gone are the 3 a.m. drives to the office to troubleshoot an alarm—today’s DevOps teams are globally distributed and able to respond instantly. Access to key metrics and insights from mobile phones and browsers shortens response times, makes collaboration easier, and ultimately makes our lives easier so we keep work-life balance in a 24/7 world.

DBA Resources

Spotlight-Cloud-Migration-header

Block, Block, Blocking on DBAs Door

Plan Caching - Reuse

Using Spotlight Cloud to Resolve Blocking

Spotlight-Page_life-Expectancy-Blog-header

Monitoring Page Life Expectancy in SQL Server

Looking for ways to get started? Download the New DBA Checklist.

New-DBA-Checklist Cover
View All ChaptersThe Definitive Guide to Starting SQL Server Performance MonitoringDownload this guide and our bonus persona template.

Chapters

close chapters modal