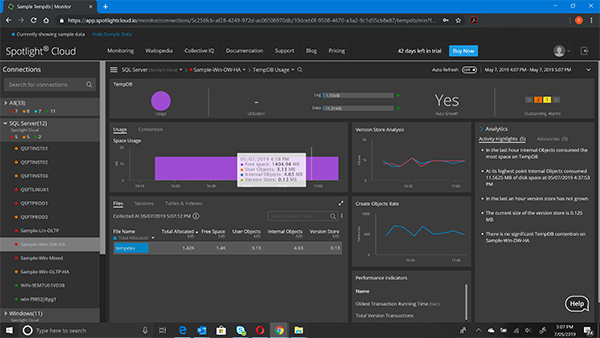
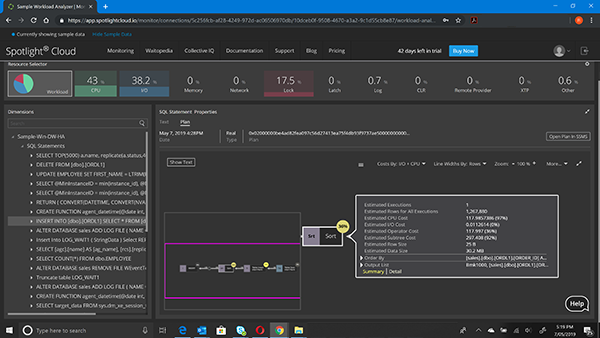
Sign in
Home blue-arrow-iconSolutions Overview blue-arrow-icon Root Cause Analysis

Root Cause Analysis

It's not enough to be alerted to a problem, you need to know how to fix it. Spotlight Cloud does just that by highlighting where in SQL Server an issue is occurring and then enabling you to simply click diagnose to drill-down and see what the cause of the problem is.

The starting points for this diagnosis are Spotlight Cloud’s Overview and Smart Alarms. They provide detailed information and alerting on performance issues, and potential performance issues, affecting the SQL Server instance. In-context recommendations provided in the solution, and the logical workflow, enable you to easily identify the root cause of an issue, allowing you to proactively manage issues and alleviate symptoms before they impact the performance of the SQL Server instance and end users.

Workload Analyzer

By leveraging the scale of a cloud-based application, Workload Analyzer is able dissect workloads across a range of dimensions. Now you can pinpoint what is having the greatest impact on specific aspects of your workload across a specific time range.

Identify how a user, database, host or even SQL statement is impacting your workload in just a few clicks.

Watch this video to learn more about using Workload Analyzer.

Want to see this solution in action? Start your free 30-day trial, today.

TempDB Drilldown

TempDB

The TempDB can seem like a black box to many SQL Server users, who don’t understand what’s going on in there.

The TempDB Usage dashboard visualizes the usage of the TempDB database of your SQL Server instance, over the selected time period.

You can drill down to see the usage and contention by specific files, user sessions and tables & indexes. The Analytics panel shows you activity highlights, for the selected time period, so you can easily identify what you need to focus on, as well as making recommendations on how to resolve current issues and proactively manage the TempDB.


Plan Advisory, Plan Viewer

A Query Plan for a SQL Statement gives you an insight into all the steps required to perform the operation and is therefore an essential tool to understand the performance of the SQL. But plans can often be large and difficult to read and interpret. The Plan Viewer provides an easy way to navigate the plan and highlights the most important operations, collapsing less important branches and allowing you to easily move around the plan. It shows operation costs in CPU, IO or both, and line widths in relation to number of rows or data size.

This makes finding the root cause of any performance issue quick and easy. In addition, with the Plan Advisory feature we automatically analyze the plan and analyze the database objects to check for missing indexes, inefficient table scans, missing statistics and much more. It then prompts you with advice on how to fix these issues.

Analyze Plans using Plan Viewer