As you may be aware, SQL Server replication is a technology for copying and distributing data and database objects from one database to another, and then synchronizing between databases to maintain consistency and the integrity of the data. It's important to know that these can be quite complex. There are three types of replication: one-way, one-to-many, and many-to-one. It's important to have each replication monitored so that you can get an early warning of any issues or failures so that these can be rectified.
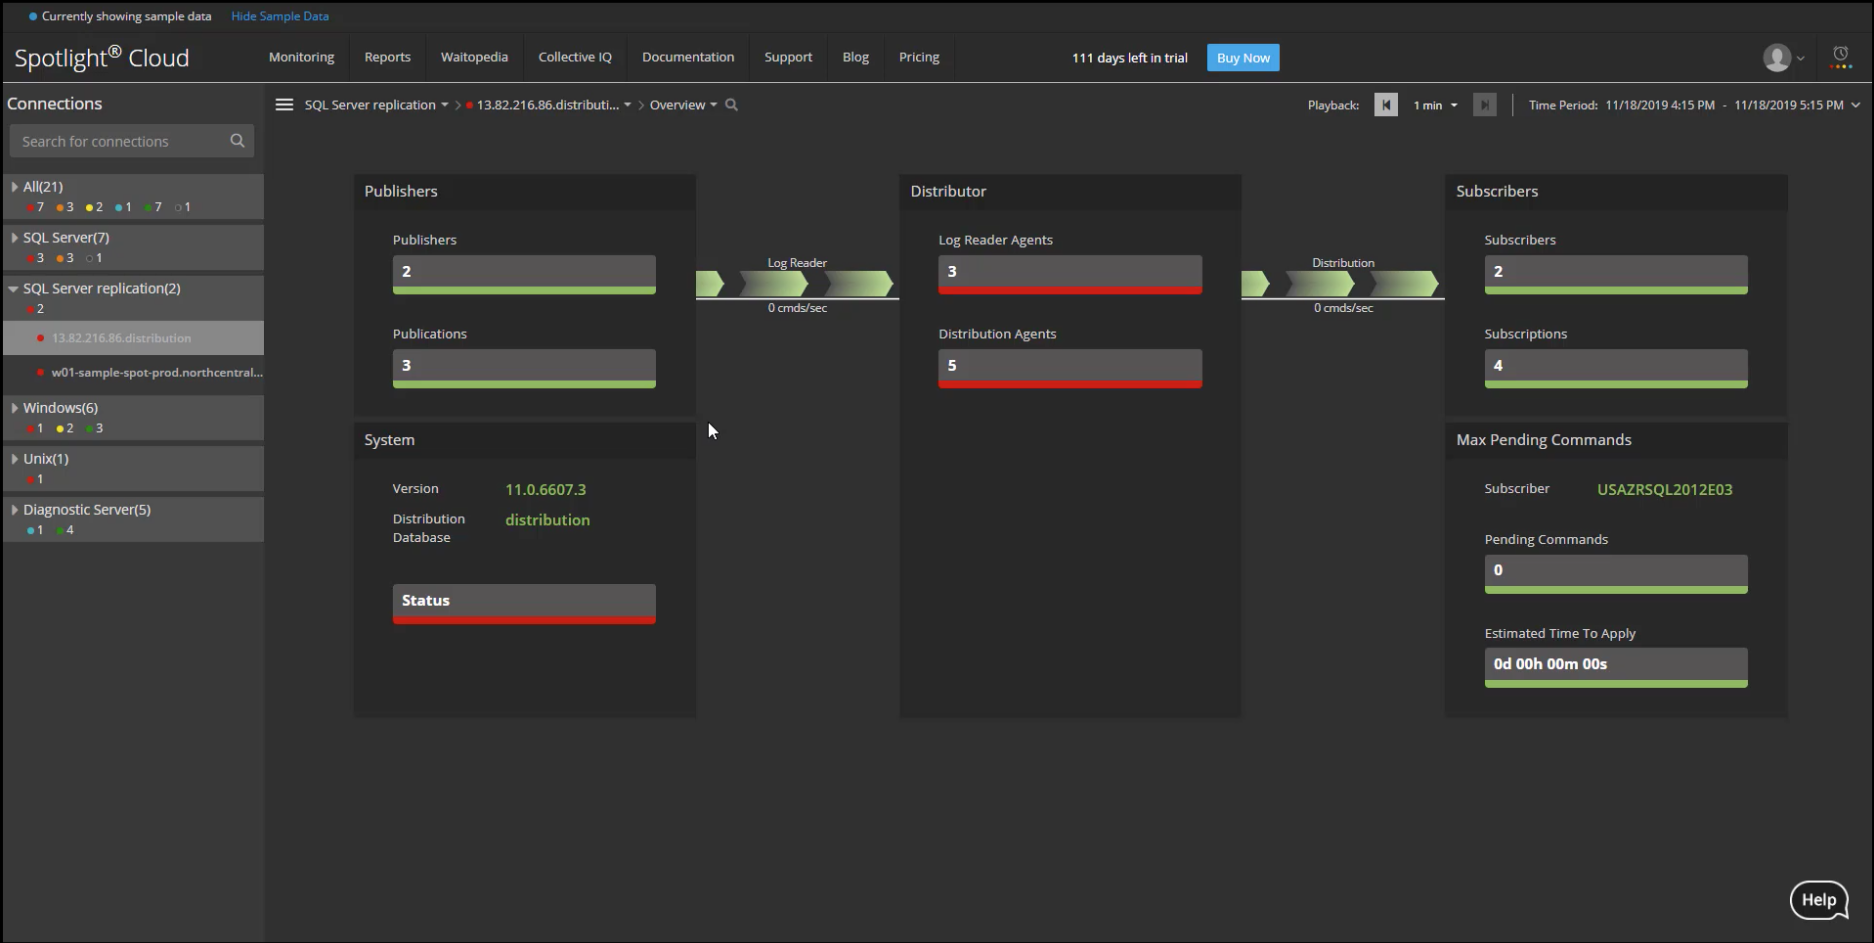
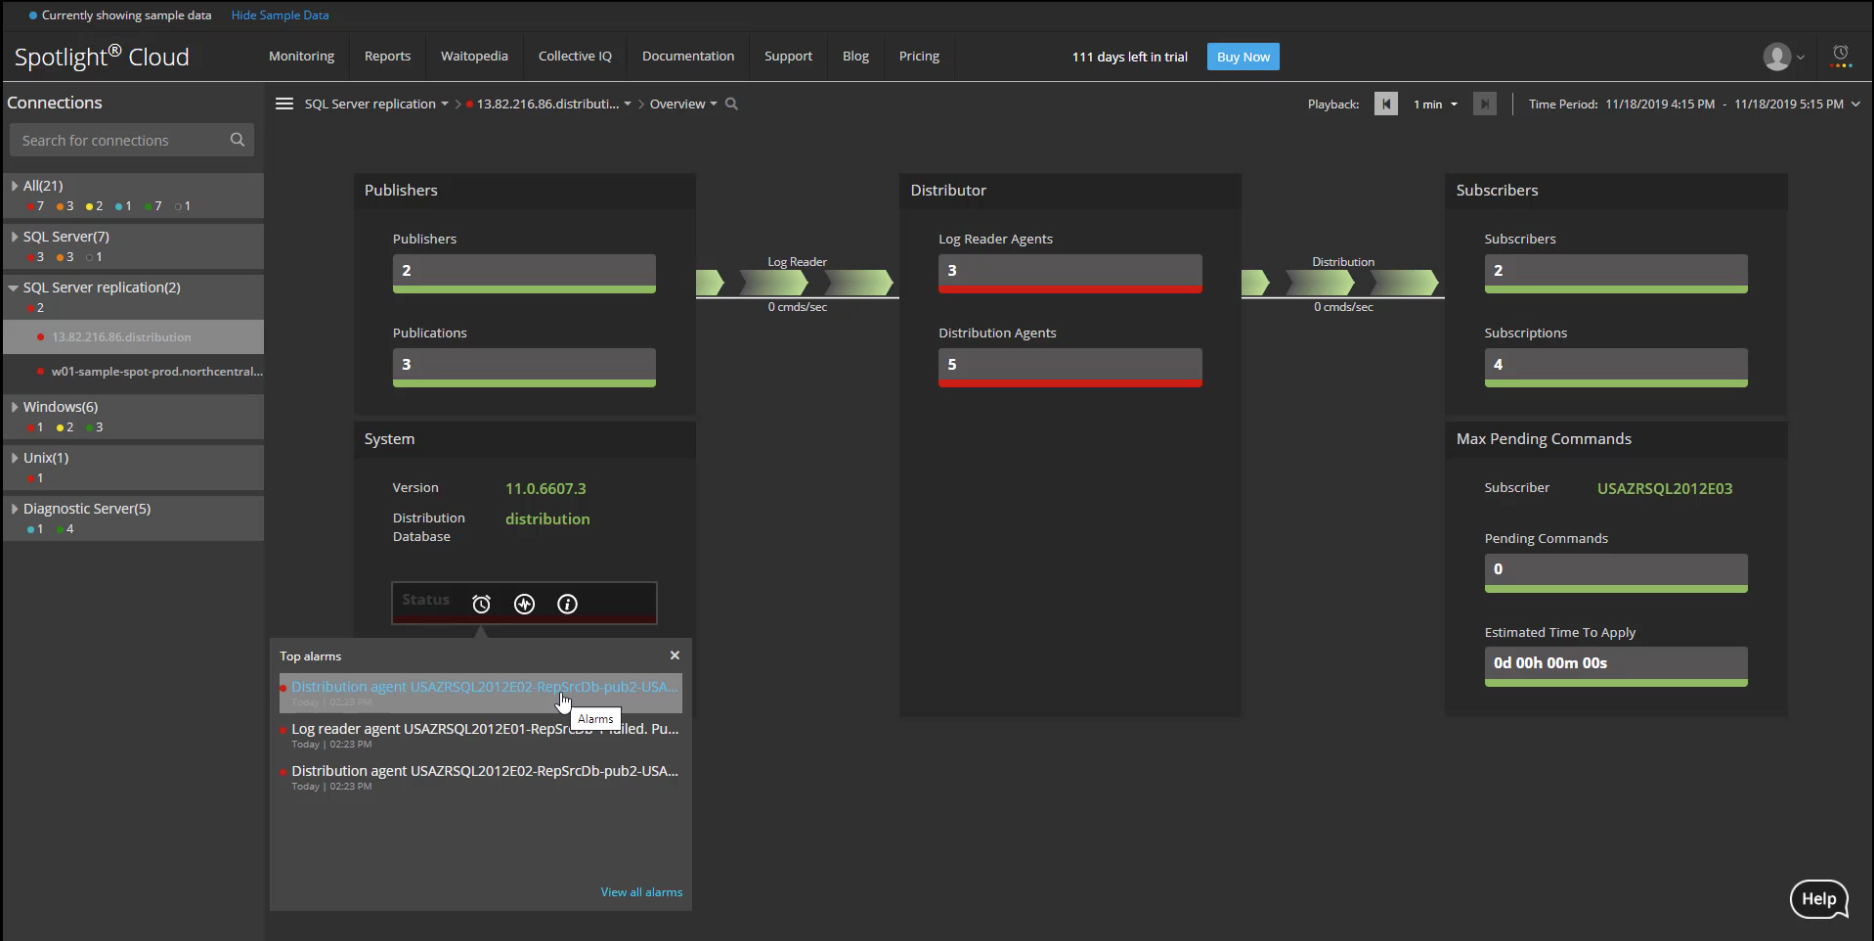
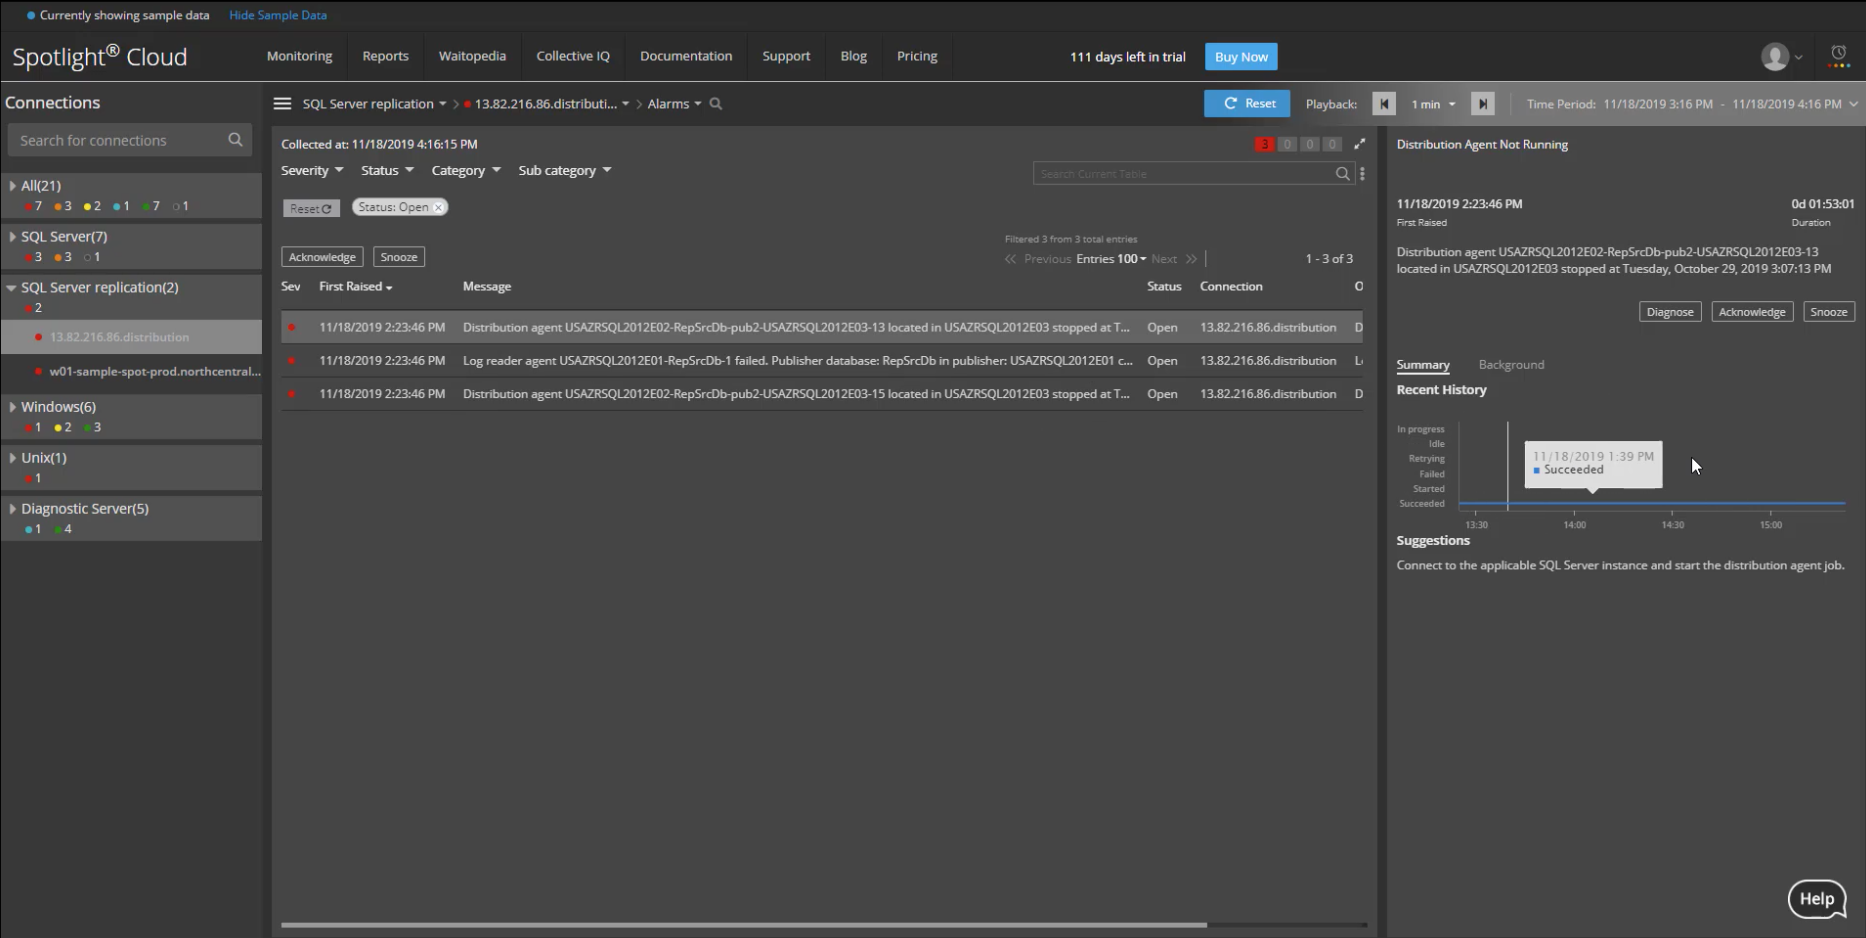
We recently introduced a feature within Spotlight Cloud to enable you to monitor Replication, and it comes with the associated alarms, which I'll cover shortly. To view the replication, you'll see it's a category on the left-hand side here called SQL Server replication. I can specify which one of the replication objects I want to investigate, and then we can drill in and see the health status of the application. This gives us an overall picture of any status alarms, the health of the publishers, the distributors, and the subscribers involved in the replication. The alarms that we have are around notifying you if there's a connection failure or any planned outages. There's actually about five alarms in total that will pick up any particular issues. If I want to check what these alarms are, I can click on the little alarms button and it will show us the distributor agents or the log reader agents that have got a failure. We can also see that across here. If we drill into the log agent alarms here.
Also, as replication is taking place, we will see the commands per second from the log reader. We'll see that as a flaw. We can also see that as a trend graph, as well. You might want to click on the to see what the flaws looked like over time, and you can also see that for the distribution side as well where we can click on that and see the trends, but also click on the "i" symbol if you want to know what that particular icon stands for.
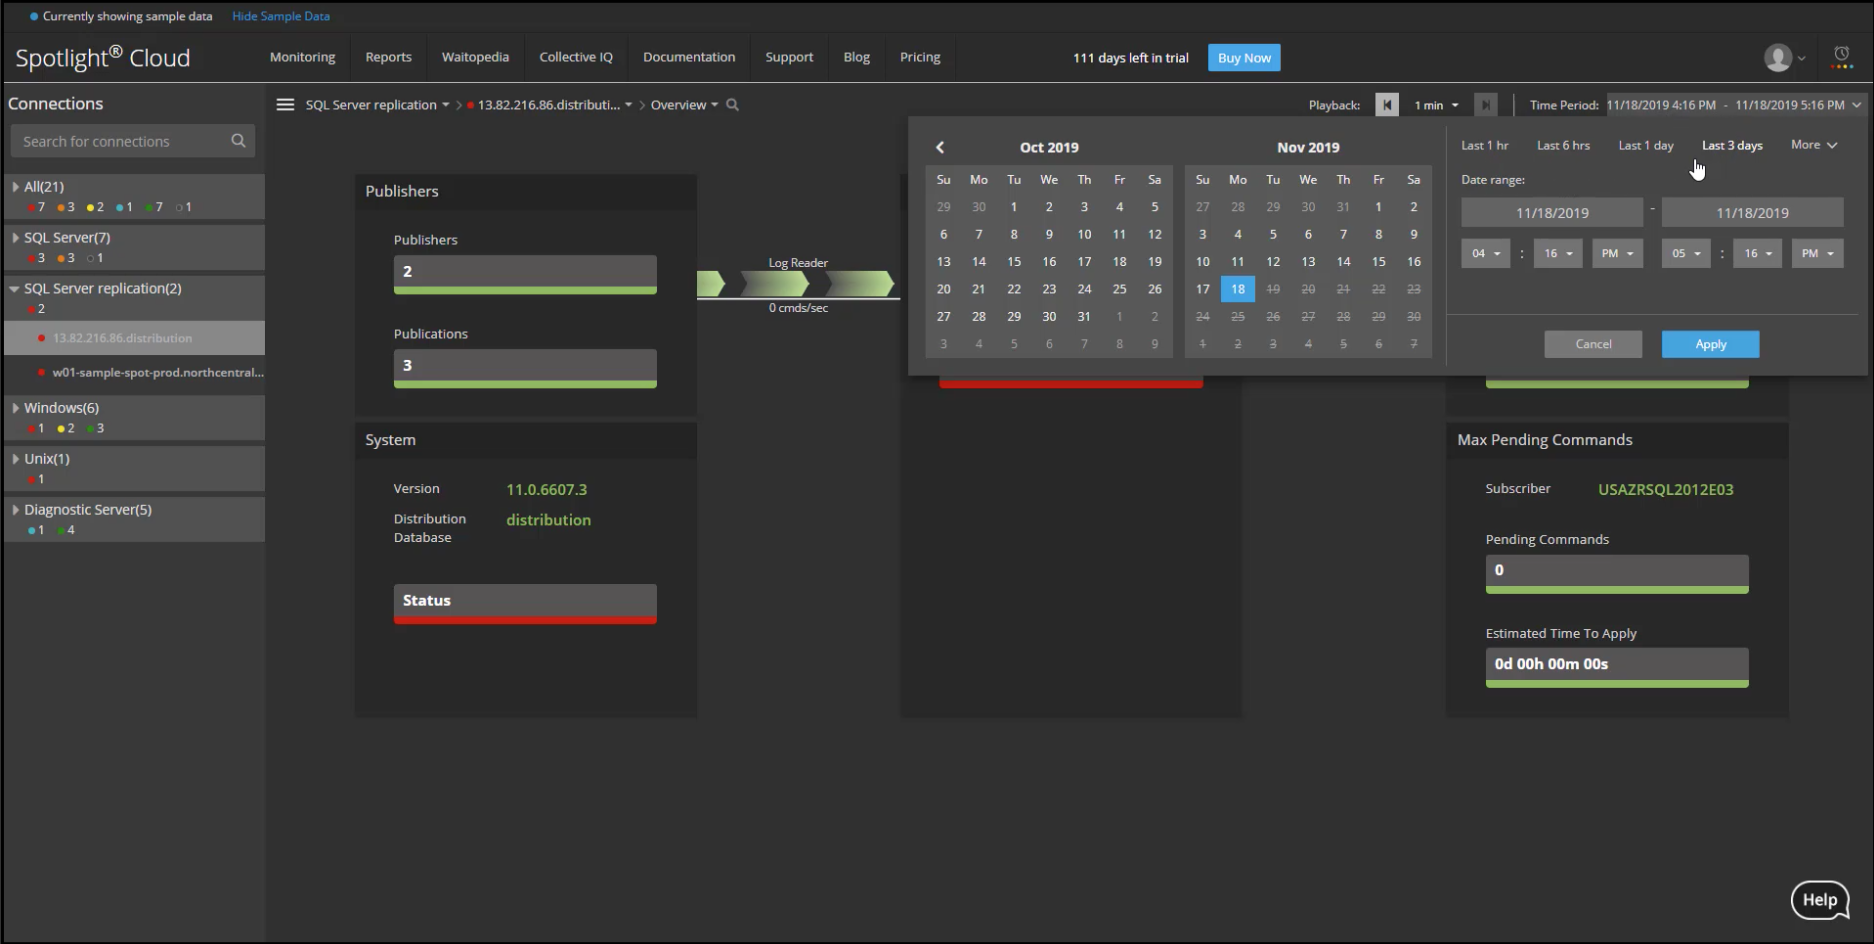
Also, don't forget with this with Spotlight Cloud on this particular feature is that if you need to go back to a particular point in time when a failure occurred, you can do that. You can either use the time period mechanism, to point the, you know, if there was a particular backlog of data or something wasn't quite right, then you can go back in time and view that over a number of days for example. Or if you just wanted to quickly go back, say, to over the last hour, you can just drill back in time to the last hour and see the alarms there.
We have the overall health of our application and then we have the overall alarms for the replication, which we can view sorted by time, for example, whether they're open. And on the right hand side for each particular alarm, we have the recent history angle as well as the background to the alarm being raised.
A very useful addition to the Spotlight Cloud monitoring to be able to monitor replication. If you have any replication-type challenges, don't forget to download a trial and start having a look at how that can help you drill down to the cause of the problems.
Watch a detailed video on replication feature.