It is always encouraged when writing queries or SQL Server database code (procedures and views) to take notice of the execution plan. There are several reasons for this. Firstly – the optimizer might be choosing a plan which you are not expecting. For example, index scanning a large table before matching with a smaller table. Secondly – consideration should be taken to how this query will perform in months or years to come if the queries are running in a new system with small tables which will grow. And finally but most importantly, how fast is this query and how much resources does it use. The last point might not seem that important, you might be thinking as long as it takes less than 3 secs that is good enough, but if it could run in < 1 sec wouldn’t that be better? If your databases are cloud-hosted, reducing resources could also save you money.
A lot of cases for SQL optimization normally comes from an issue which is detected by the end-user or your monitoring software. “Why is this report taking 30 mins to generate?”, “What is causing that spike in I/O wait” or “Why are these jobs taking twice as long to run as they did last year?”
In all these scenarios it still comes down to some knowledge about execution plans and the best way to fix the SQL to improve the situation and this can be very time consuming and not always successful.
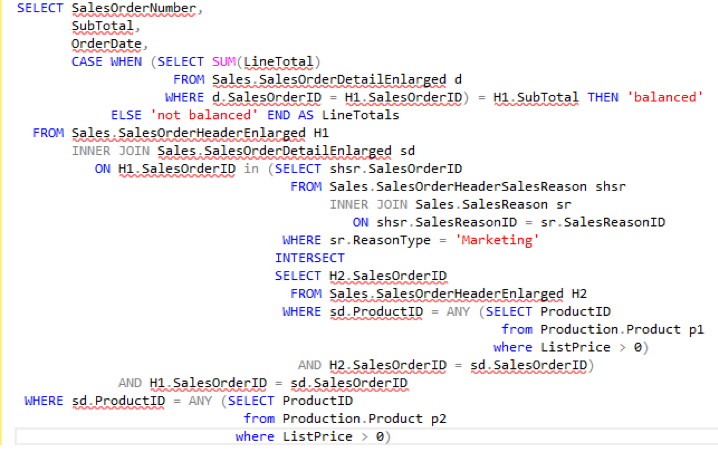
Let’s take an example. So, you are writing a new query, executing it, and then thinking, oh dear this is taking too long.

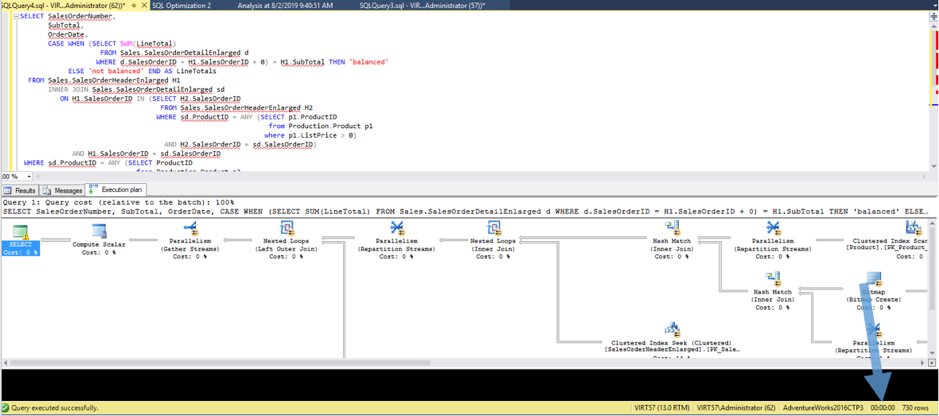
17 secs for 730 rows, what should I do?
First, let’s review the execution plan:
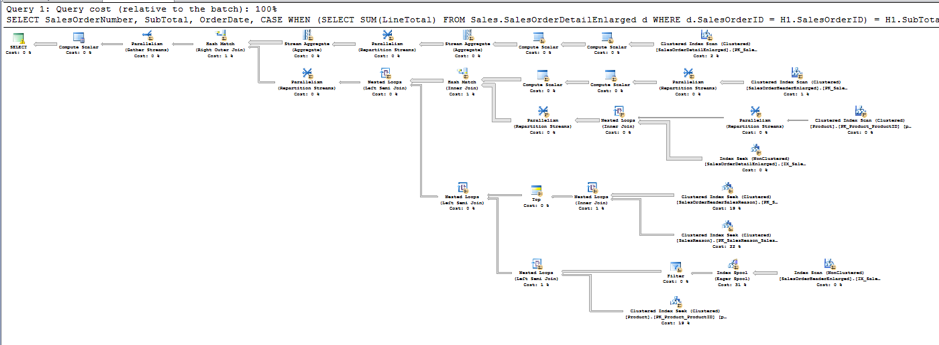
This isn’t always straight forward if you have to zoom in and out to make sense of it. So, the first bit of advice is to get a good plan viewer such as this one with the Spotlight Tuning Pack.
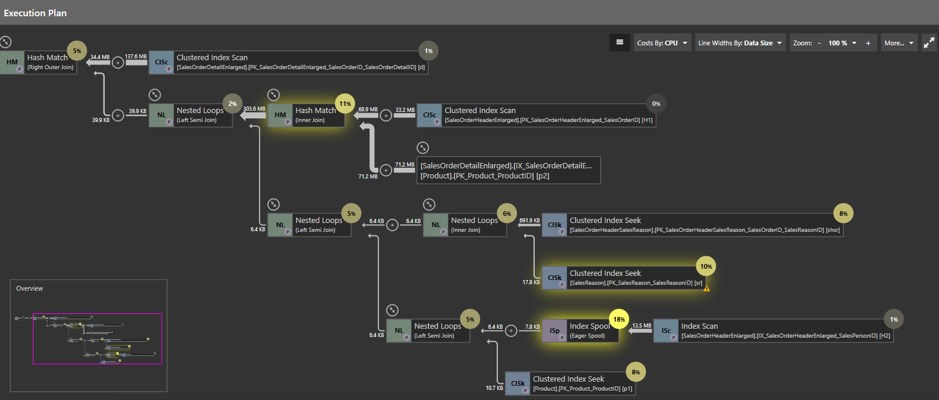
The plan viewer highlights the key bits of information we need and where the main operations are as well as highlighting any warnings.
Here is an example:

So, there’s a problem with this code, but what can we do about it?
Well, actually quite a lot. We could use query hints, look at adding some indexes (don’t forget this might impact other queries and DML), adding bits of code that don’t change the result set but influences the optimizer to generate a different plan and little tricks to stop the optimizer considering a particular index it is using and maybe generate a new plan. But this is all trial and error and very time consuming to do manually.
By adding the Spotlight Extensions application to SSMS and subscribing to the Spotlight Tuning Pack we can let the optimization feature in the Tuning Pack do all the hard work for us.
You might have noticed in the first screenshot that when the feature is enabled, it automatically detects that optimization is possible:

Click on View Analysis

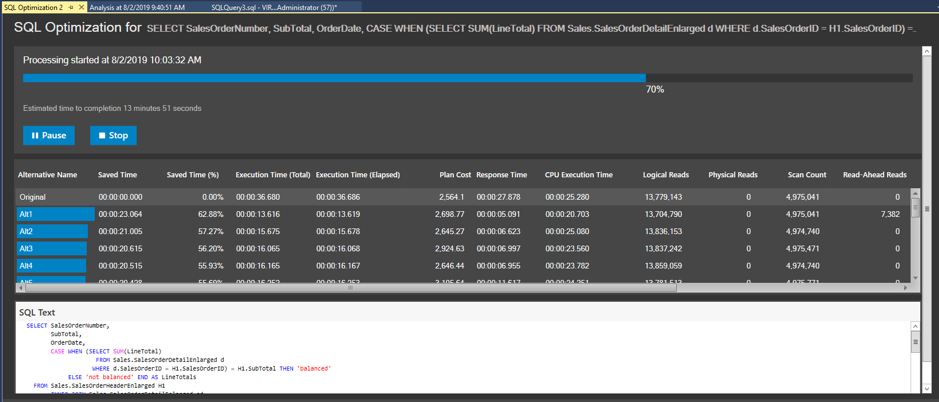
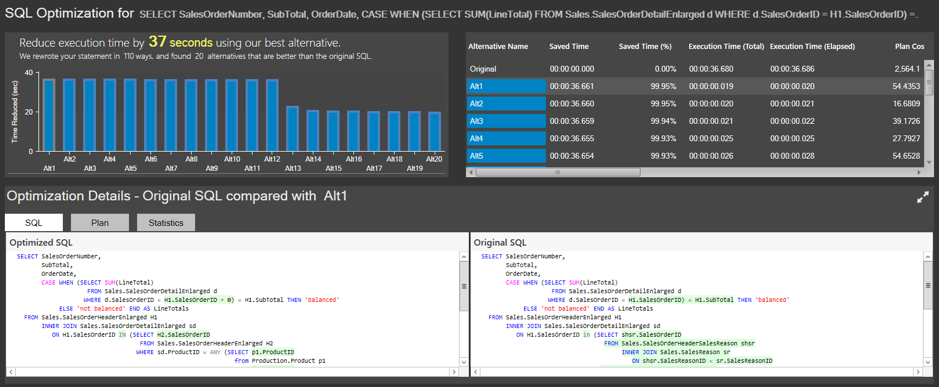
You can then click the Optimize button and the optimizer engine will analyze the code and start to apply rewrite rules that will change the syntax of the SQL giving alternatives which provide the same result set, and then test them so we can see if any alternative execution plans are faster and why. The rules are applied in combinations so the possible alternatives could be over 100. However, the tool only shows you alternatives that are faster than the original.
This process runs in the background and saves you an immense amount of time if you attempted to do this manually.
And when the results are shown you can compare the alternatives, see the code differences, compare the plans and review the statistics.
So, back to SSMS with my new version of the query and test it out.
Success.
If this is in a development environment, you might want to consider flushing the buffer cache using DBCC DROPCLEANBUFFERS, to test your queries with a cold buffer cache without shutting down and restarting the server.
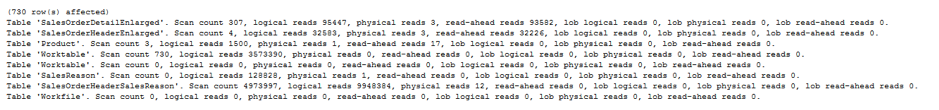
Also, consider adding SET STATISTICS IO ON to the query for more info on why the query syntax made a difference:
Original:
Rewrite:
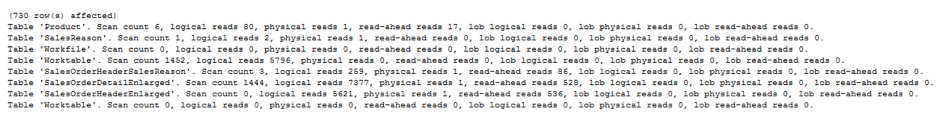
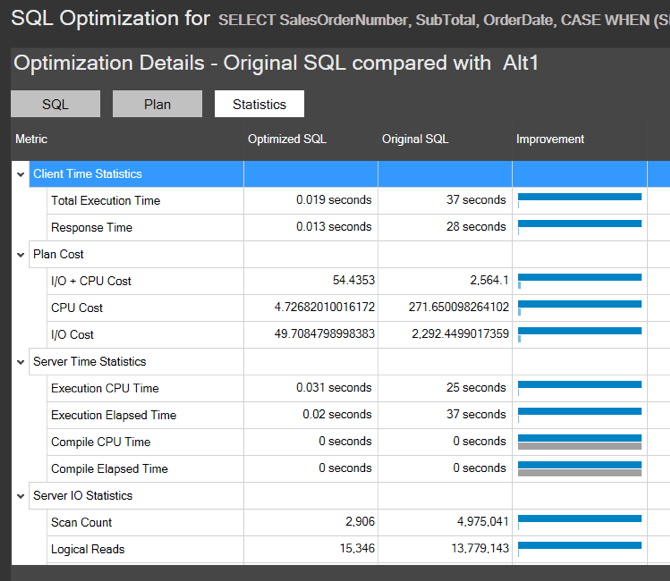
And this can also be achieved in the Tuning Pack with the statistics compare feature:
So, with the successful change and happy end-user, on to the next query. By continually improving the performance of individual queries, we improve the performance of the instance.