As a DBA, finding the right tools to rely on for database performance monitoring can be tricky. There's a variety of tools to choose from with both free and paid options. How can you tell which database performance monitoring tool is right for you? Consider trying a free option that gives you the opportunity to convert to a paid subscription; if you find value from the free tool, you can always upgrade.
Spotlight Cloud Basic is a SQL monitoring subscription that provides free access forever, for up to five SQL Servers and five host operating systems. You can monitor each of those SQL Servers, along with up to five Windows operating systems.
If you have the operating system hosted on a virtual machine, you can monitor that, as well, which is really important because it enables you to make sure not only that the SQL Server is running smoothly, but also that the operation system that it is running on is performing well enough. For example, if the CPU usage is constantly hitting 100, that will obviously affect the SQL Servers. By providing monitoring of both the SQL Server and the underlying operating system, Spotlight Cloud Basic enables you to have the full picture of your environment.
One of the best things about Spotlight Cloud Basic is that if you are away from your desk, you have access to a mobile app for either iOS or Android. You can download the app, sign in, and see alarms and a heat map and details about how your SQL server environment is currently performing. That way, you have peace mind when you are not at your desk, which enables you to have a little bit more freedom and not have to be constantly looking at your desktop screen to see if there are any issues with your servers.
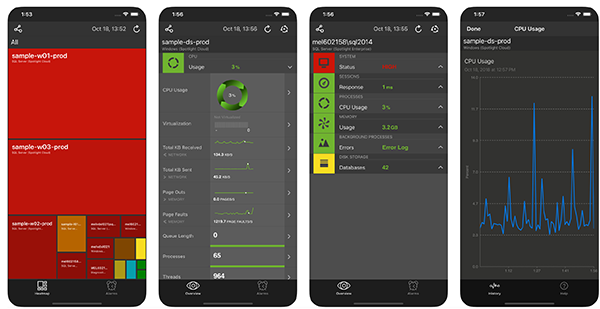
Mobile monitoring using the Spotlight Cloud iOS App
Popular Features of Database Performance Monitoring Tools
Like the professional version, Spotlight Cloud Basic provides a heatmap. The aim of the heat map is to show you how to prioritize the view of your servers so that it is easy to figure out which server needs your attention right now and which servers you can leave ‘til later.
The heat map uses severity codes to help with prioritization. The server might be red if it's got a high-severity problem, orange if it's medium, yellow if it's low, or blue if it's just information about what's occurring on that server. If the server color is green, then there are no issues at all with that particular server.
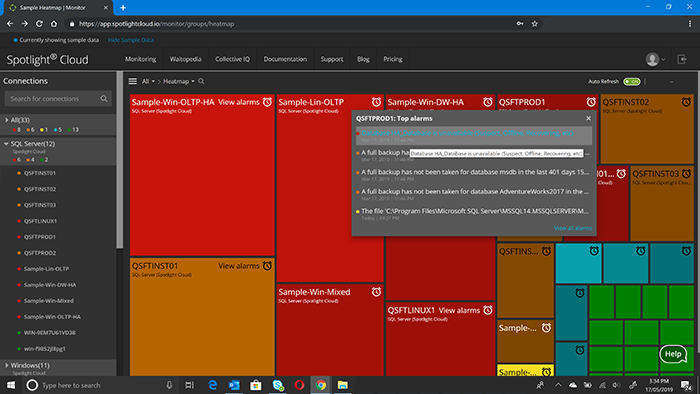
Heatmap
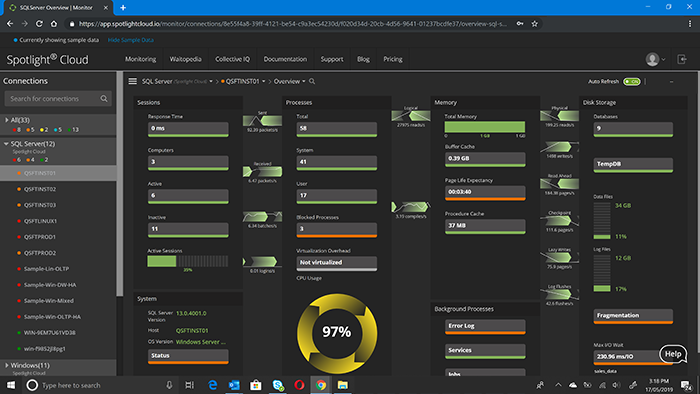
If you have five SQL Servers running, which is the limit of servers that you can monitor with Basic, and one is showing the high-severity alarm, you can click on that server and access the Spotlight Cloud Overview screen for that SQL Server. The Overview screen provides you with a visualization of the SQL Server as it is performing; it represents the architecture of the SQL Server and shows the data moving between different parts of the SQL Server. You can see data flying into a database and going back out. If there is a problem with a particular area, that area is highlighted using the severity colors mentioned above.
For example, if you see a TempDB database on the Overview screen, and it is highlighted red, you know that it has a high-severity alarm and you need to take action. In the interface, you can click on that TempDB notification and view the alarm and the details.
An additional example is if TempDB was reaching its maximum capacity and almost completely full, you would be able to see what was occurring there and you would see alarm details. Unfortunately, from that point, you can't actually diagnose the issue from Basic very easily; you would need to use the professional version in order to do that.
Overview Pages Surface Key Database Performance Stats
There are other features on the Overview page that you can use to understand if there are any issues with your environment. For example looking at the CPU control, you will be able to see any processes occurring and CPU usage percentages. If the CPU usage starts getting over 80 percent, you will see the color change and it will become a medium- or high-severity alarm as it gets closer to 100. From there, you can understand by looking at the alarm details what the underlying issue is with the CPU, what the utilization is, and what might be causing it.
The "Sessions" panel of the Overview page enables you to see any sessions and whether that are currently active, or inactive. On the "Processes" panel you're able to see any processes that are blocked, and you will see alarms in relation to those blocked processes. You will be able to see if there is a particular session that is blocked, so you can identify that session and take action to resolve it.
Disk Storage is another part of the Overview page, which displays monitoring metrics for Databases including TempDB, Data Files, Log Files, Fragmentation and Max I/O Wait to give you an overview of the status of the storage and highlight any issues with alarms. Again, you will see an indication of the alarm severity for each control. If every control is green, then that means you don't have any problems, but if you see yellow or other severity colors, you can view the alarms for those and take action.
The "Memory" panel will show you page life expectancy, how full the procedure cache is, and the buffer cache, as well as how much total memory is currently available.
There are two other panels: Background Processes and System.
- The "Background Processes" panel displays the error log, services and any jobs that are running and if there are any problems with those jobs alarms will display with details about what went wrong.
- The "System" panel displays the overall SQL Server Status. So if this is green it means that the SQL Server has no issues. It also includes System information like the SQL Server, Host and OS Version.
SQL Server Overview
Health Checks That Monitor Your Database Performance
Another key feature of Spotlight Cloud Basic is the health checks, which are run frequently against your environment. These checks look at a range of different areas and give you advice about whether there is something you can do to improve the health of your environment. These might not necessarily be things that are affecting the SQL server performance right now, but they may cause problems in the near future.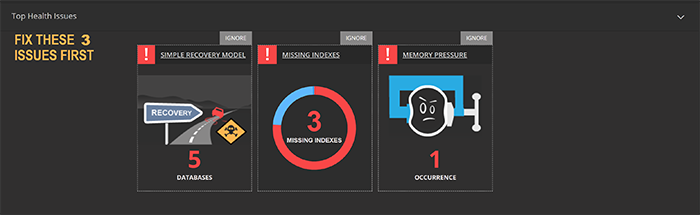
The highest priority health checks are displayed so you know what needs your attention first
For example, if you have a backup that is missing for a database, the health check will tell you. It might be a database you don't care about, in which case you can ignore that health check. But if it's an important one, you will be able to implement the backup, which will remove the risks that you would have a problem with in the future where you would have a missing backup.
Spotlight Cloud Basic can perform eight different health checks. Missing indexes is a particularly useful one. If you have a query that you are running, and it's constantly scanning this table and it's taking a long time to execute the query because of the scan, the missing indexes health check will tell you that you need to add an index if that is the best option to resolve the problem. This check will also give you the script for adding that index, which will make it easier if you need to make that change.
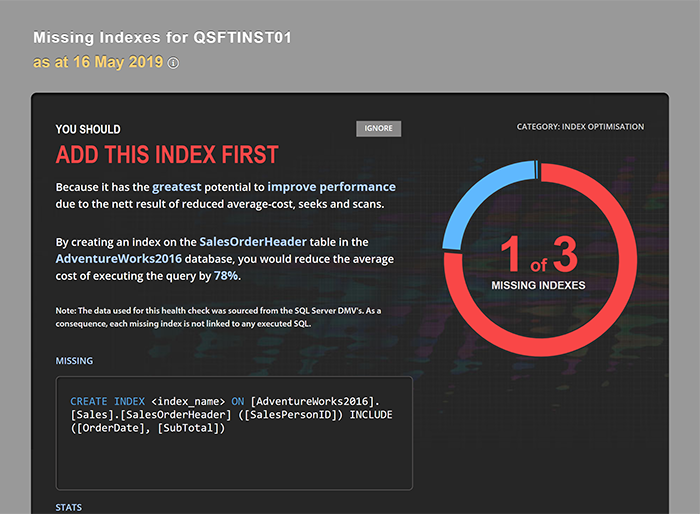
Missing Index Health Check
Other health checks that are available include health checks around security. For example, if you have issues with the security around login, such as with guest user access, a security health check would notify you and you would be able to take action to resolve that before it actually causes a problem.
By using health checks to prevent problems occurring, you reduce your workload. Often, when a problem occurs, it has a snowball effect. For example, if the backup is missing and the database goes down, you can't restore from the backup, which means that the database is unavailable, which then affects the application, and so on. With health checks helping to prevent some of these issues, you can rest assured that you won’t one day suddenly be flooded with several problems at once.
Database Performance Monitoring Alarms
I want to elaborate on the alarms mentioned above. There are up to 200 alarms available as part of Basic. These alarms cover a wide range of issues, from things like blocked processes, as I mentioned, to TempDB and utilization. Each of these alarms displays in the user interface, where you can filter them and dismiss alarms you have resolved. You can also snooze alarms so that if an alarm goes off while you are fixing something else, the new alarm doesn't distract you. Once you have finished resolving an issue, you can acknowledge it and add a comment as to how you resolved that particular issue, so if it happens again you can see that comment and remind yourself of what the situation was.
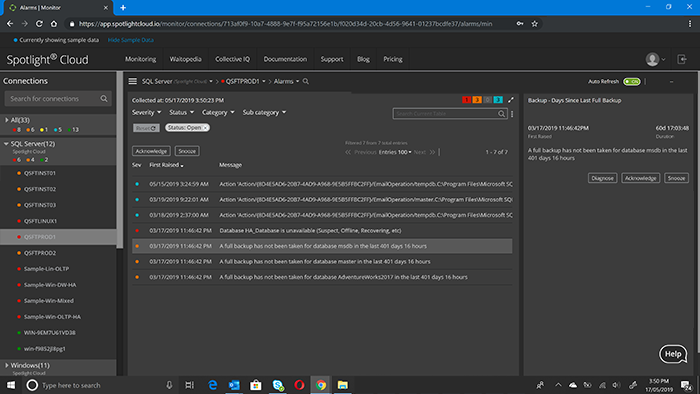
Alarms
Statistics and Information on SQL Server Wait Events
Another feature available with Spotlight Cloud is Waitopedia. Waitopedia is a SQL Server waits encyclopedia. Essentially, it provides a definition of lots of SQL Server wait types— and there are very, very many of them. If you experience a particular wait type in your SQL Server environment and you are not sure what is causing it or whether it is normal or abnormal, you can go to Waitopedia and you can look up the wait type.
Just use the search to locate your issue and see how common it is across our Spotlight Cloud community so you can understand if other people are also experiencing that same wait type or if it is an anomaly. Whether it's something particular to your environment or also occurring in the environments of others in the Spotlight Cloud community. When viewing details of a wait type, you will see a definition of the wait, a number of charts where you can see the impact of this wait type on the rest of the community and trends over time. There is also an indicator in the user interface that tells you how common or how rare a particular wait is.
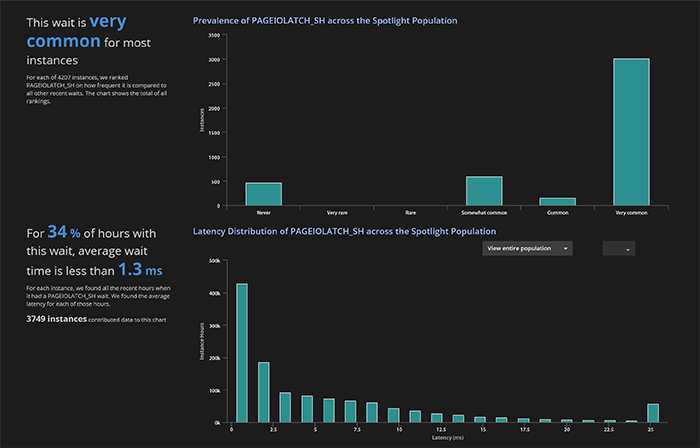
PageIOLATCH_SH wait prevalence and latency experienced across the Spotlight Cloud Population
SQL Server Demographics
Lastly, I will quickly mention Collective IQ. That term really refers to demographic information about SQL Server types that are used by our Spotlight Cloud population. “When I say Spotlight Cloud population,” I mean the thousands of users of Spotlight Cloud. You can see in Collective IQ what SQL Server versions users have as a percentage of the population. So, for example, if you are running SQL Server 2008, and you are thinking maybe it’s getting pretty old and you should be upgrading to something newer, you can see how many other people are running 2008. Collective IQ will tell you if you are in the minority here or if 2008 is fairly widely used.
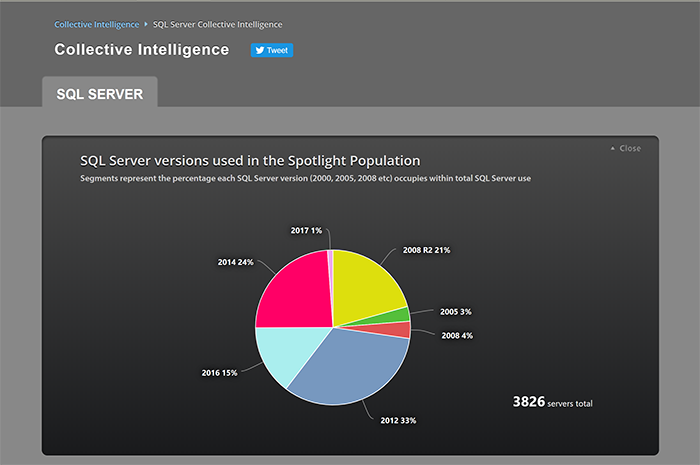
SQL Server version usage across the Spotlight Cloud population
With Spotlight Cloud Basic, you also have access to a number of videos that will enable you to get tips and advice about how to improve SQL performance and how to use the product. If you are looking for tips and tricks on ways to get the best out of Spotlight Cloud Basic, you can access those videos via the Spotlight Cloud website.